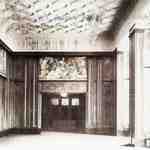
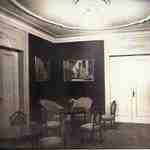
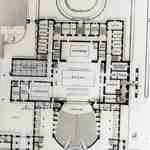
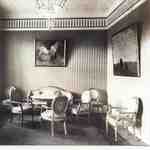
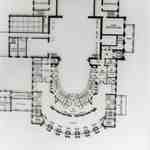
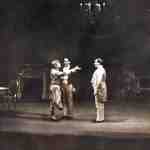
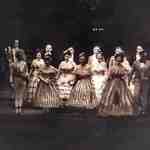
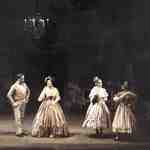
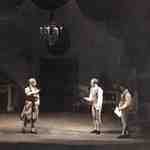
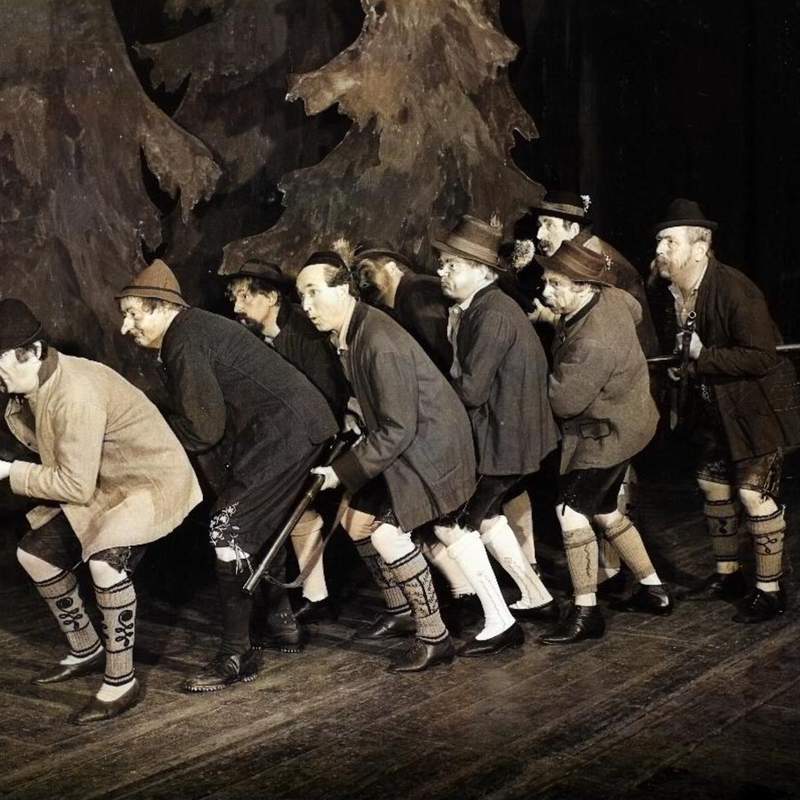
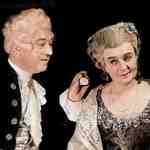
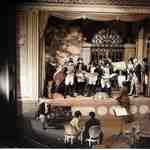
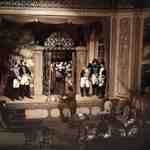
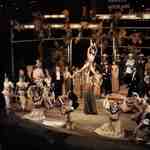
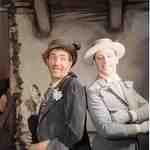
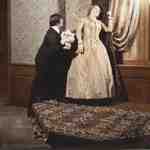
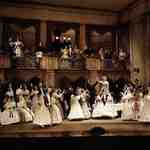
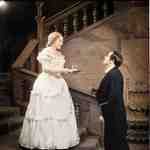
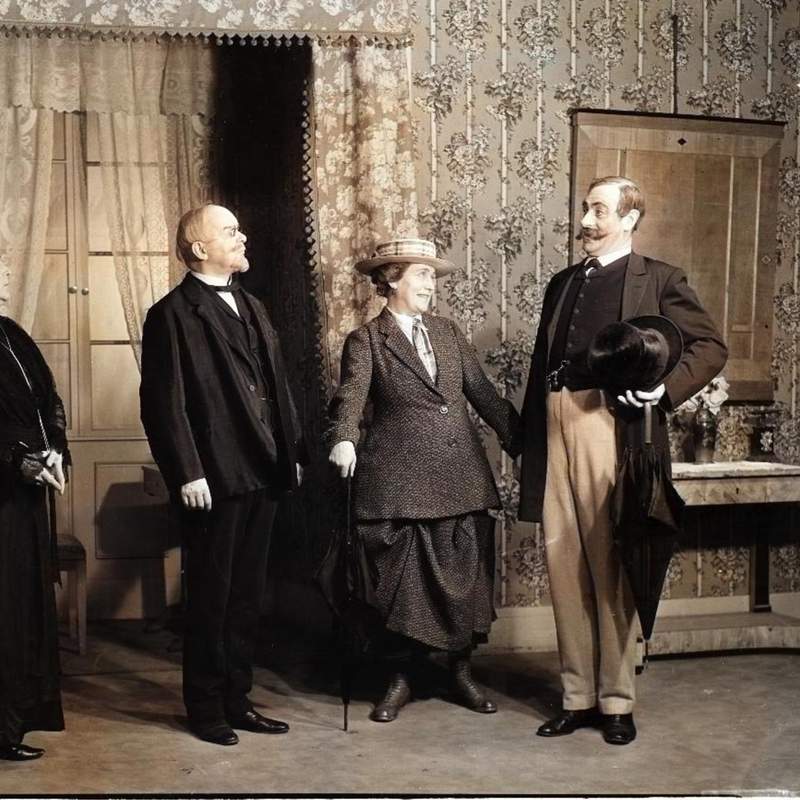
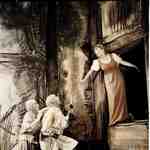
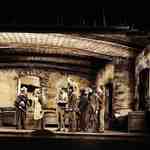
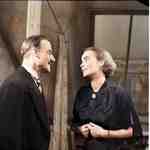
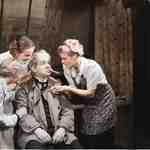
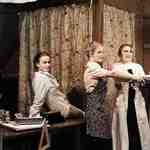
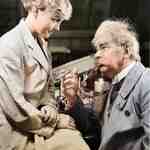
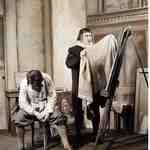
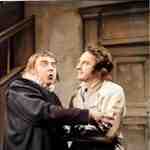
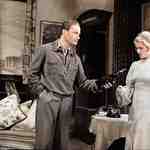
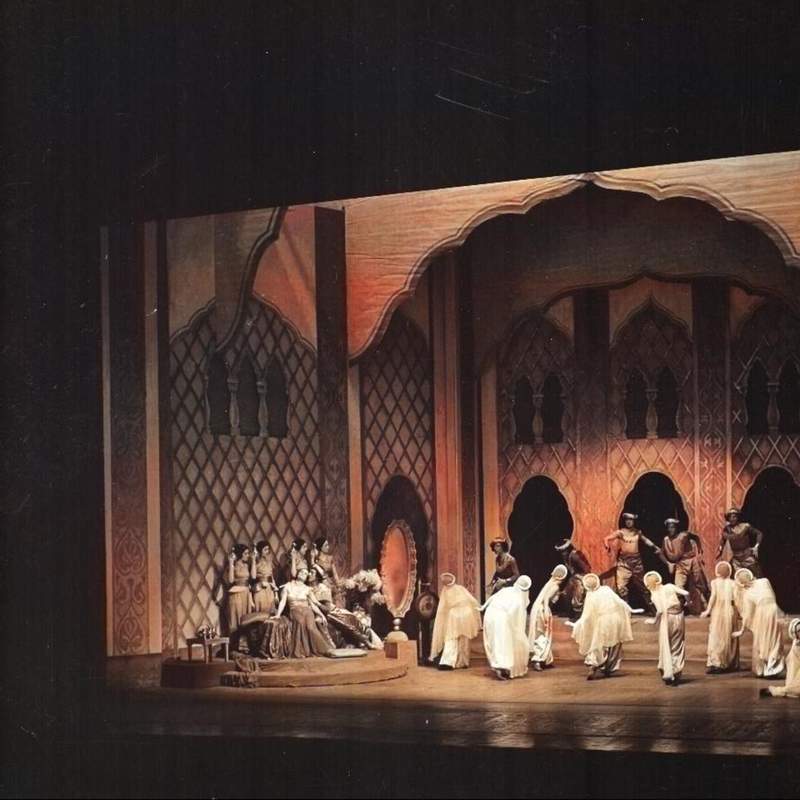
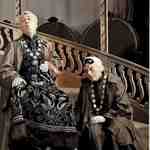
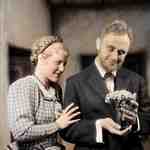
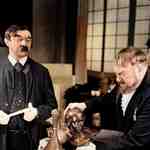
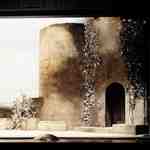
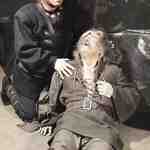
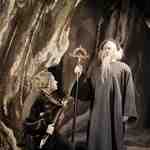
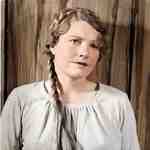
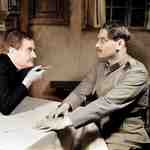
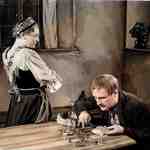
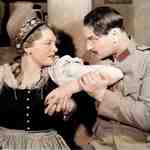
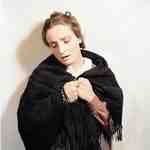
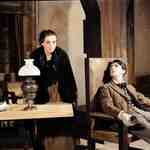
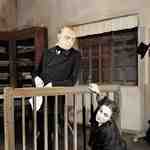
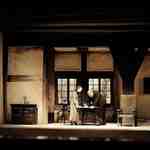
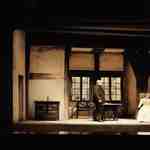
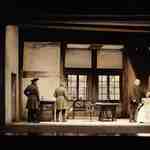
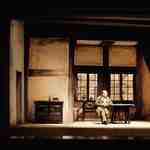
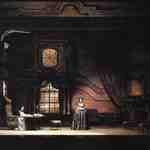
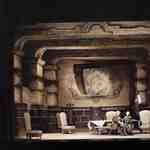
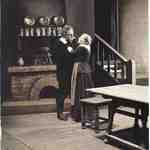
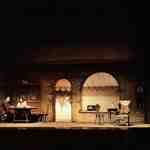
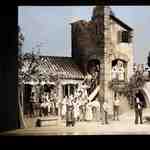
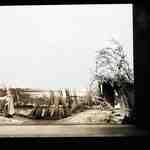
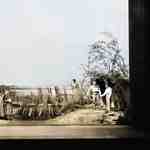
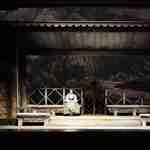
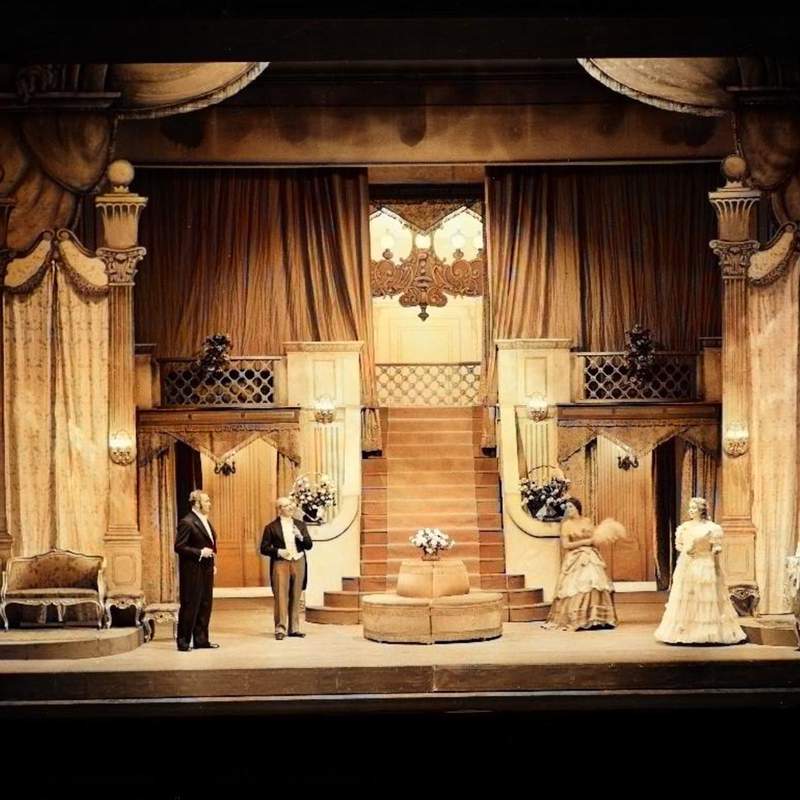
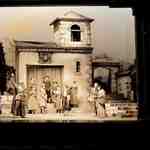
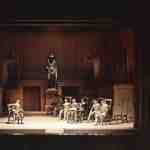
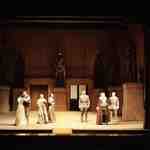
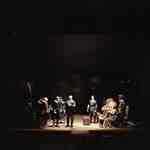
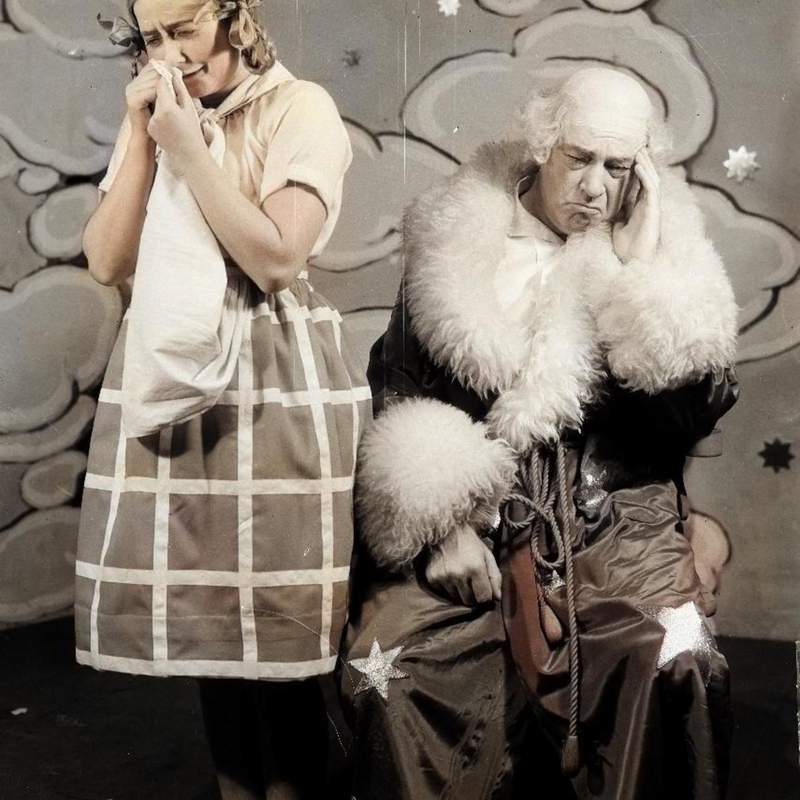
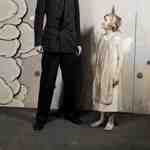
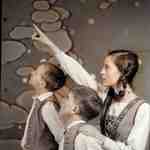
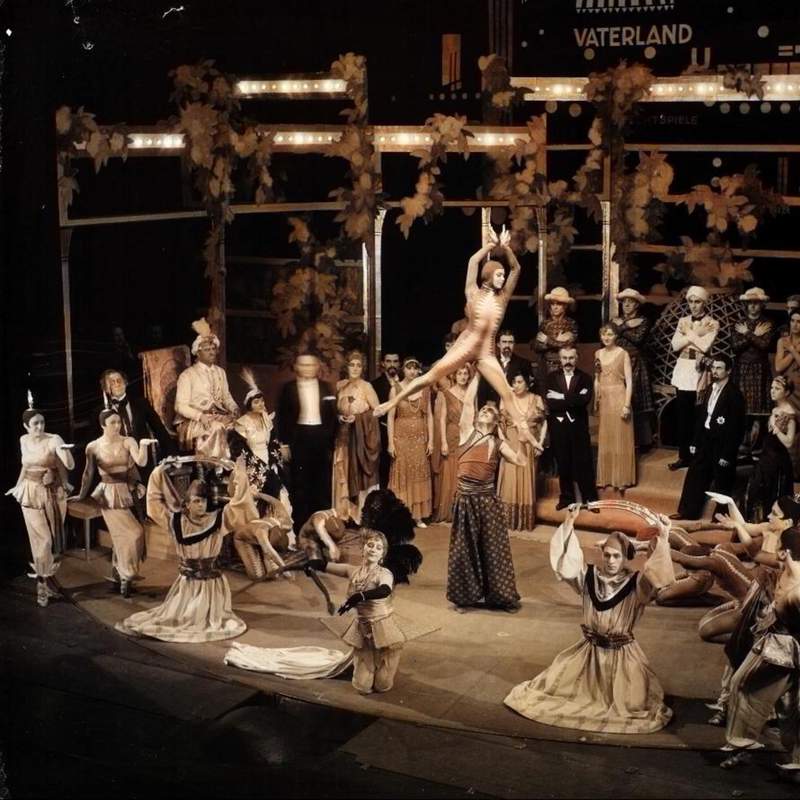
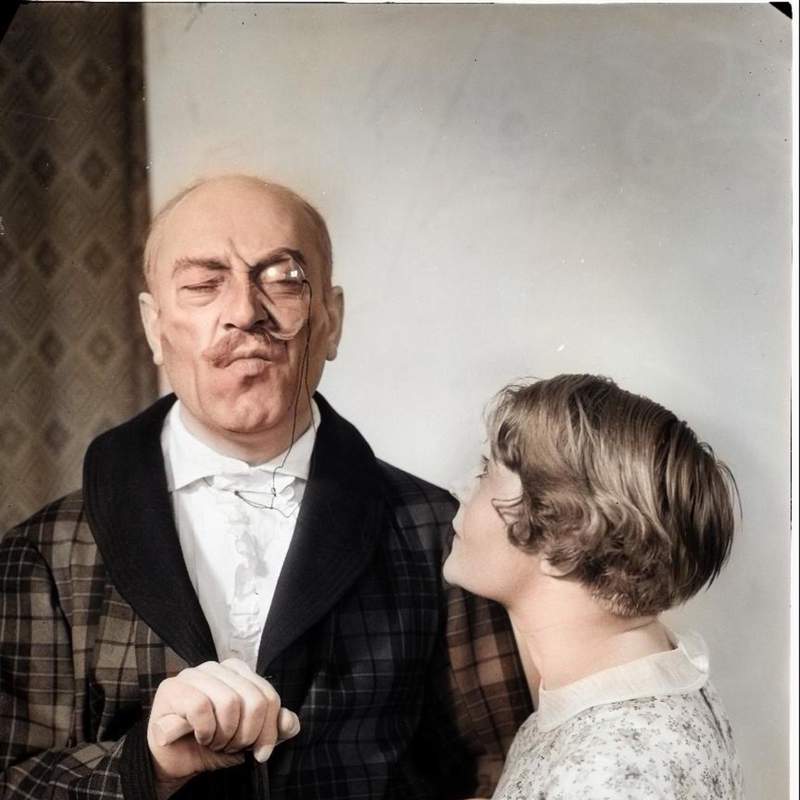
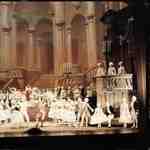
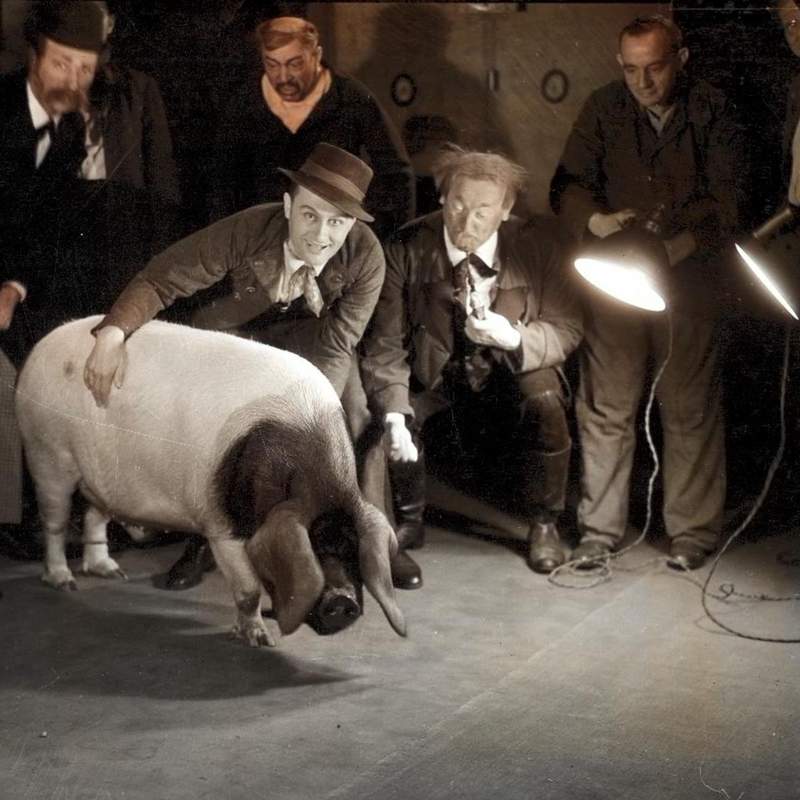
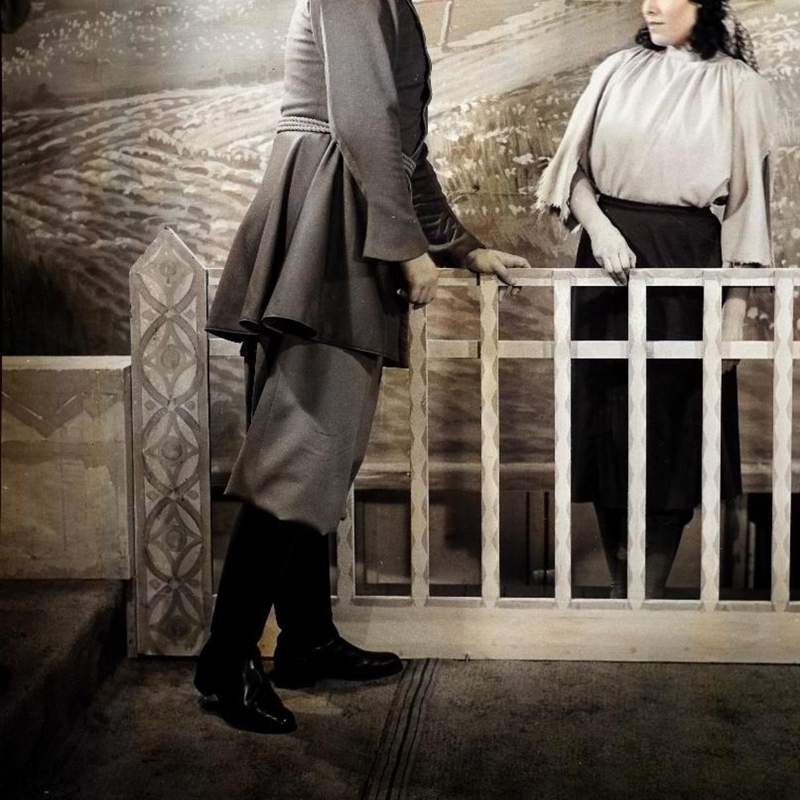
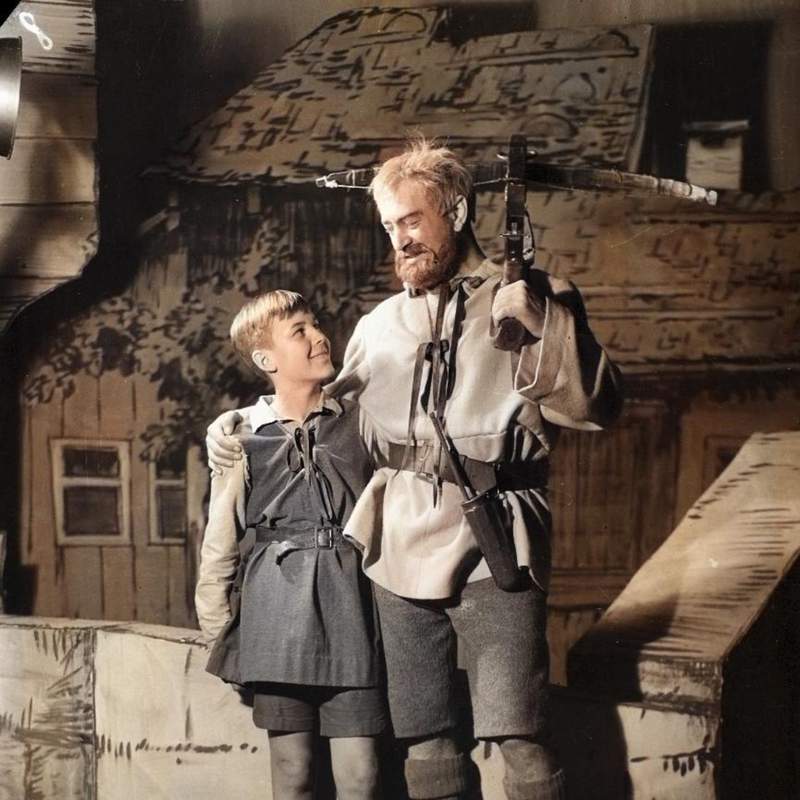
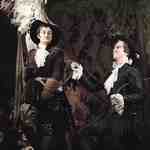
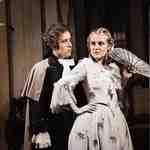
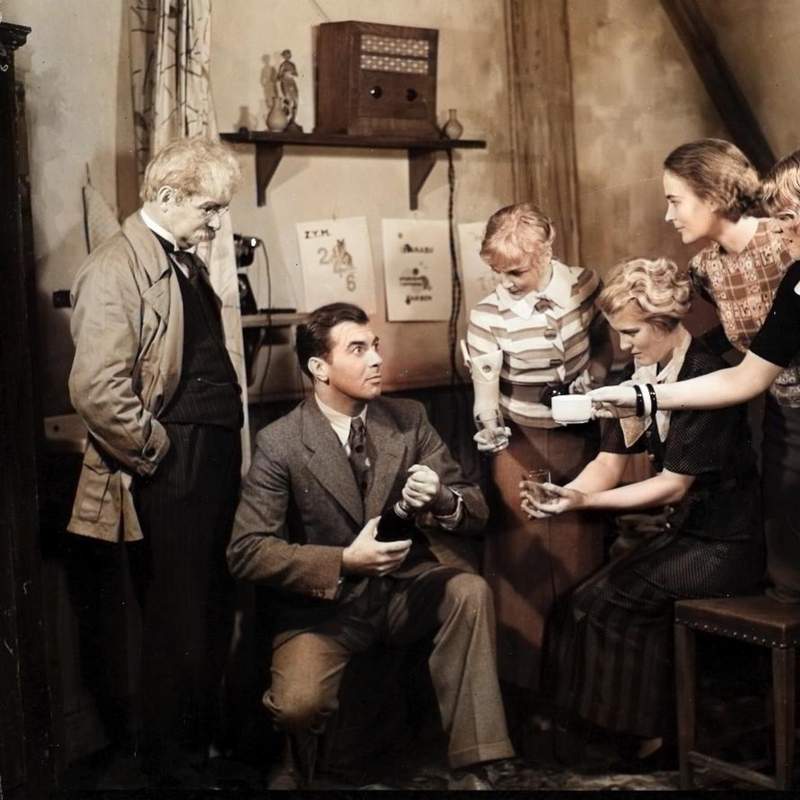
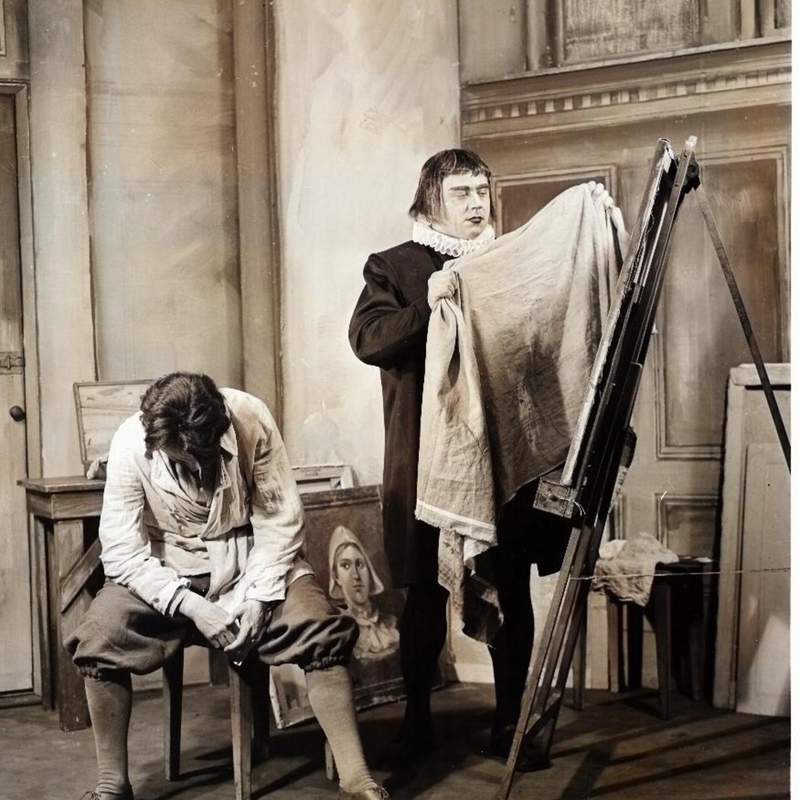
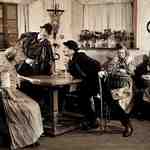
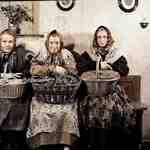
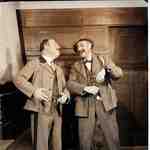
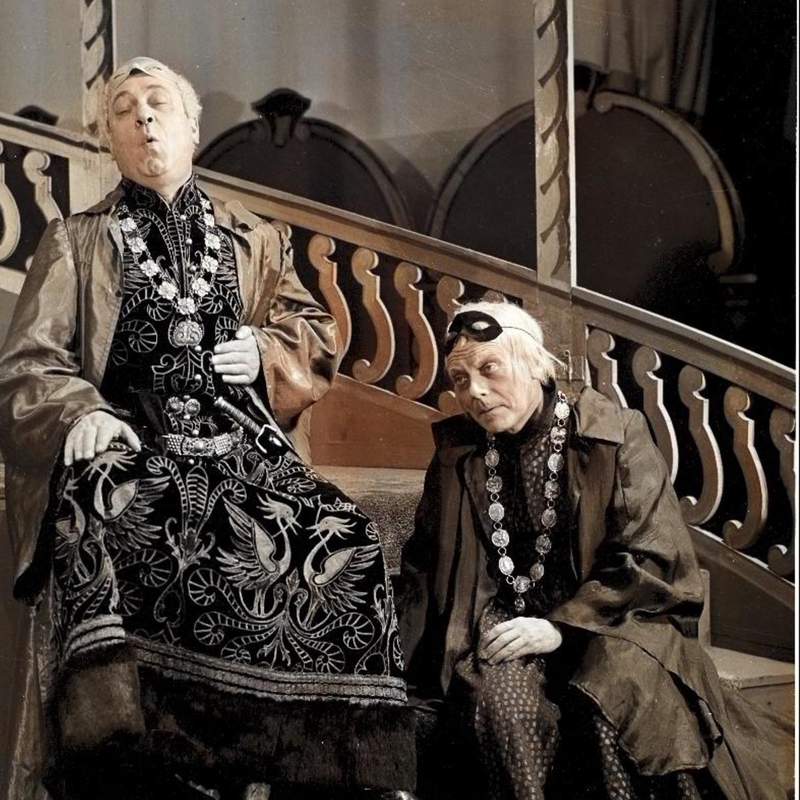
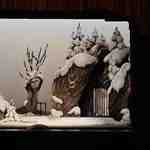
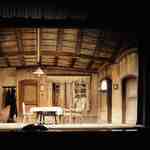
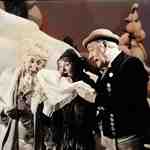
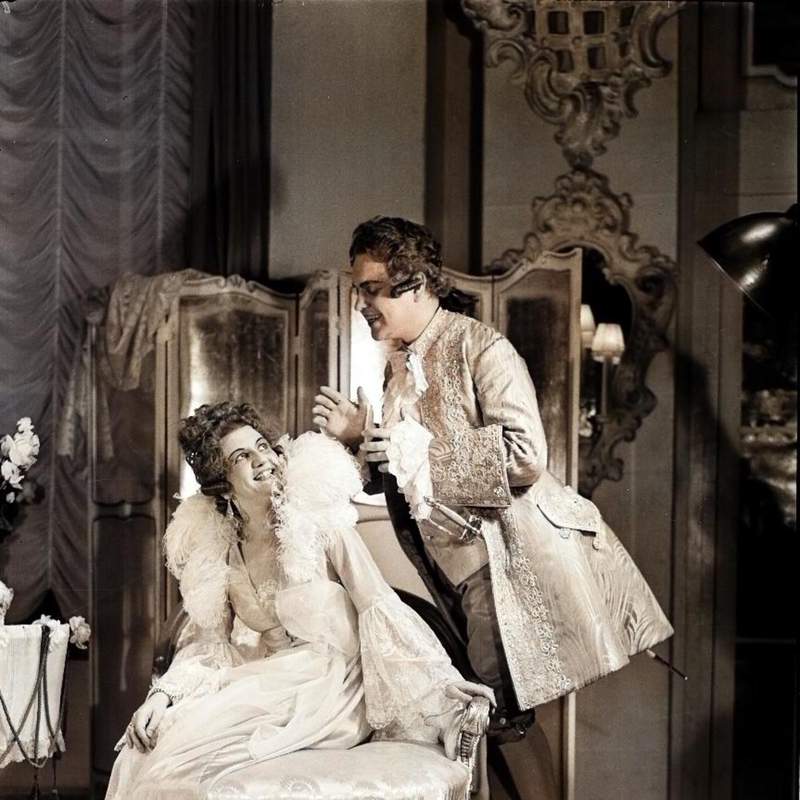
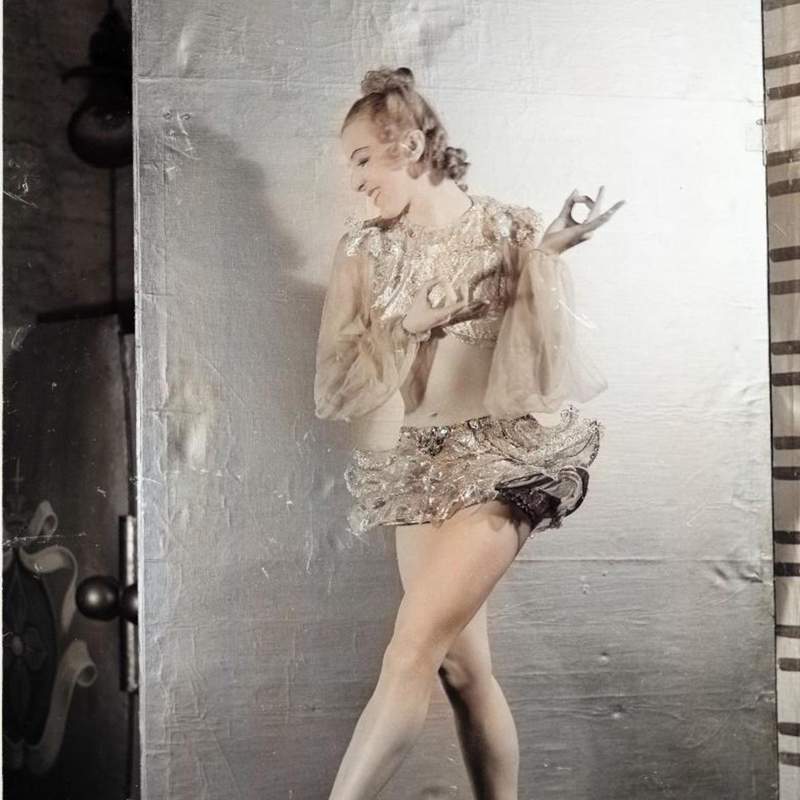
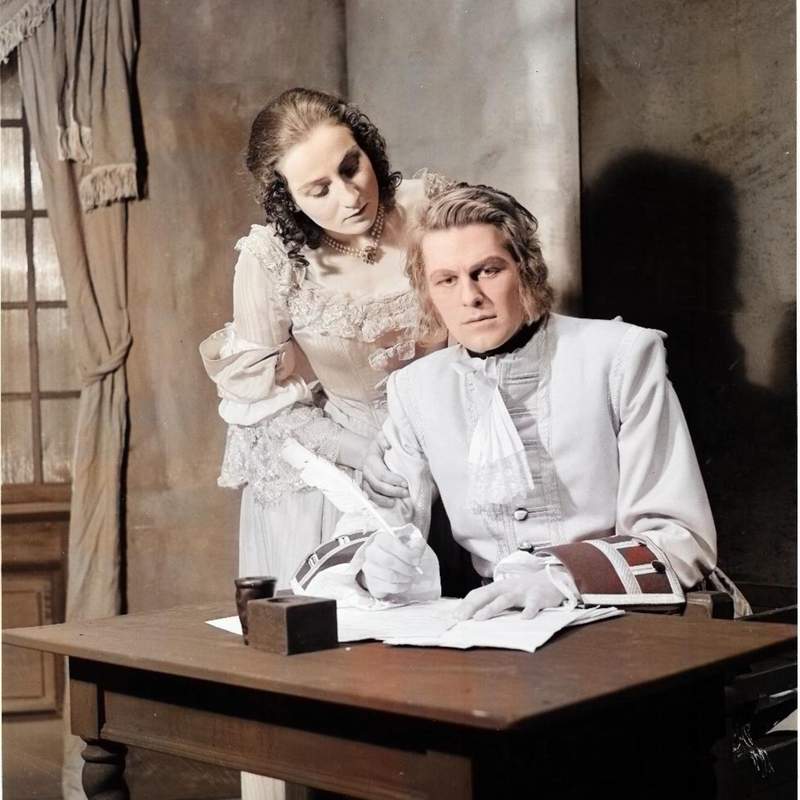
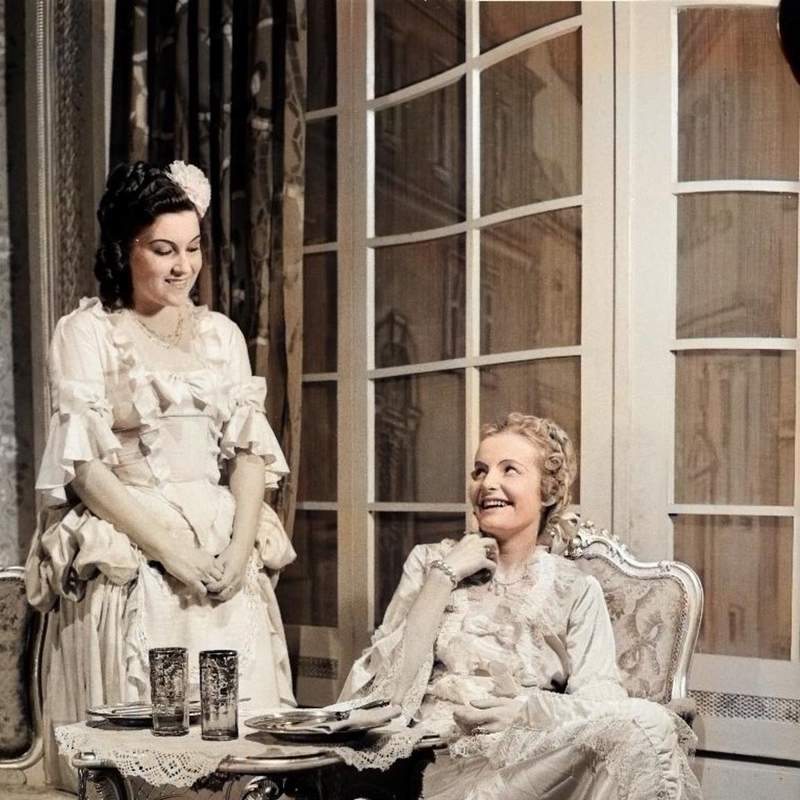
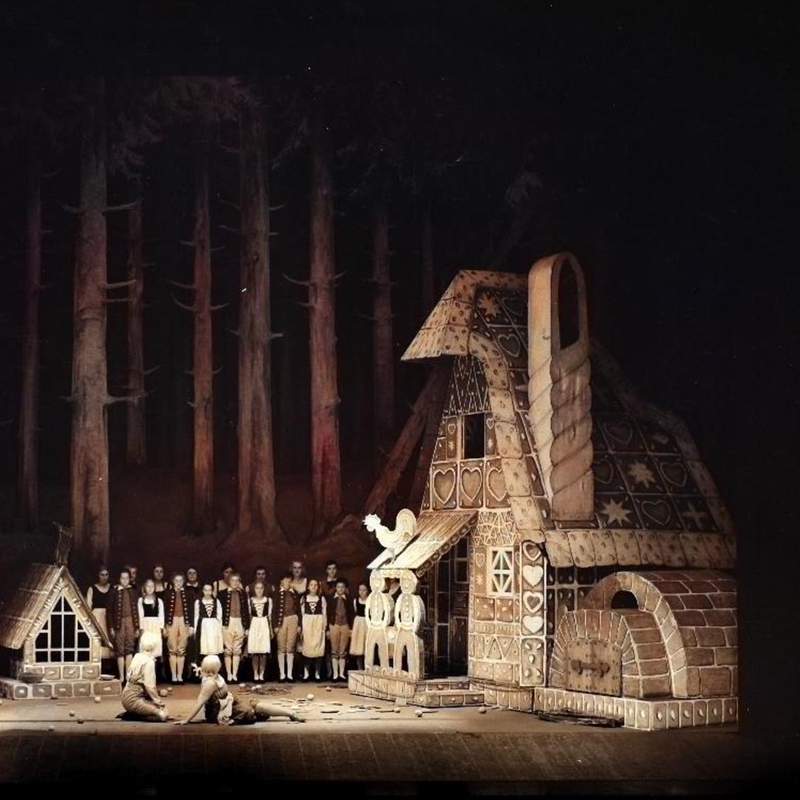
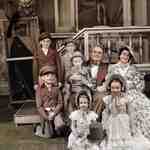
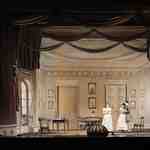
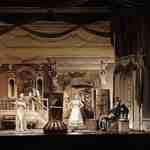
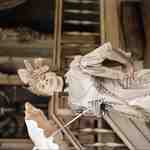
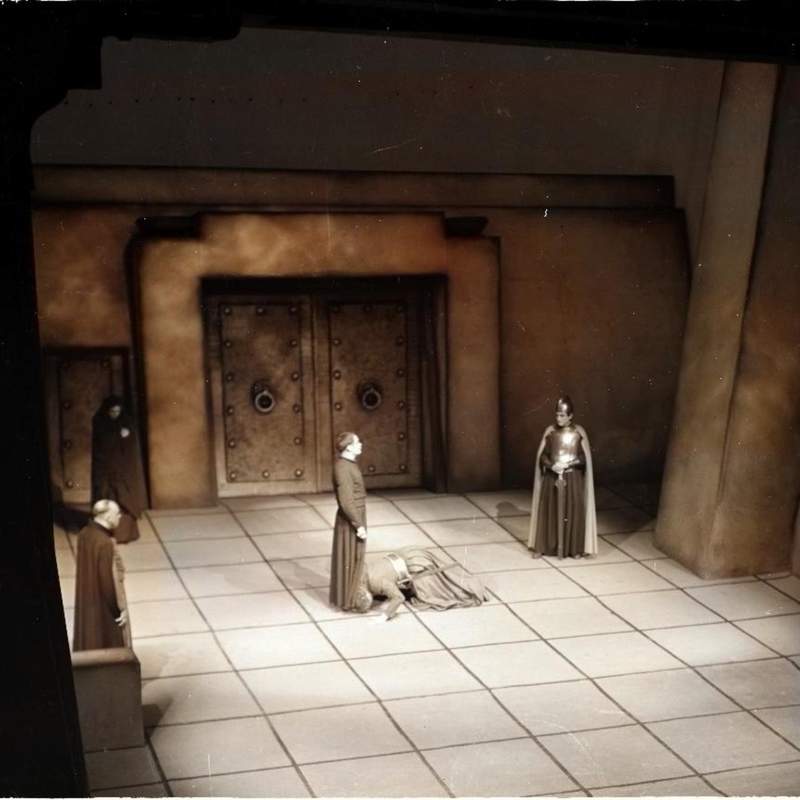
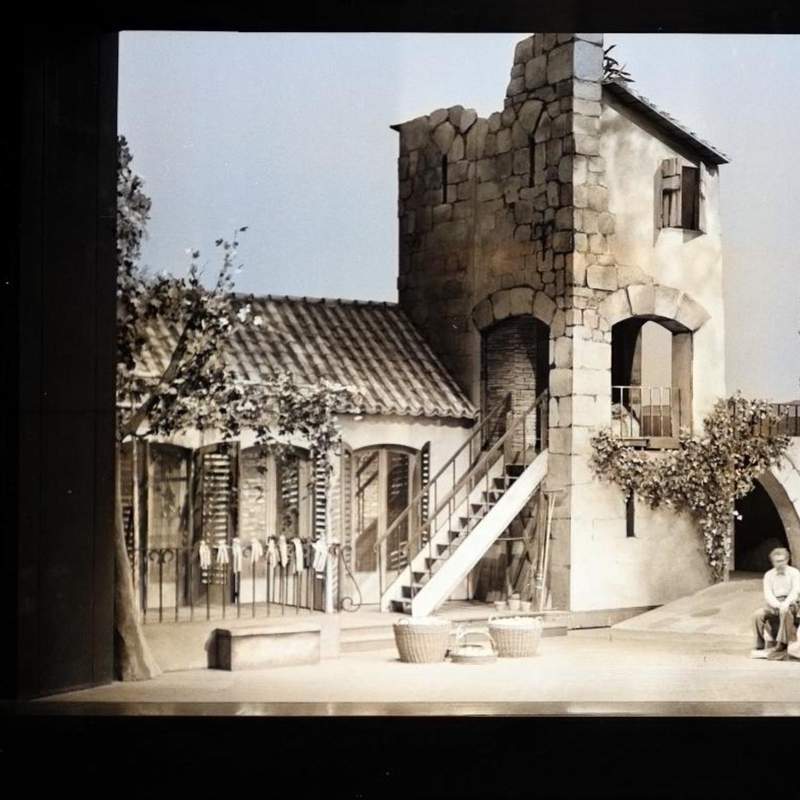
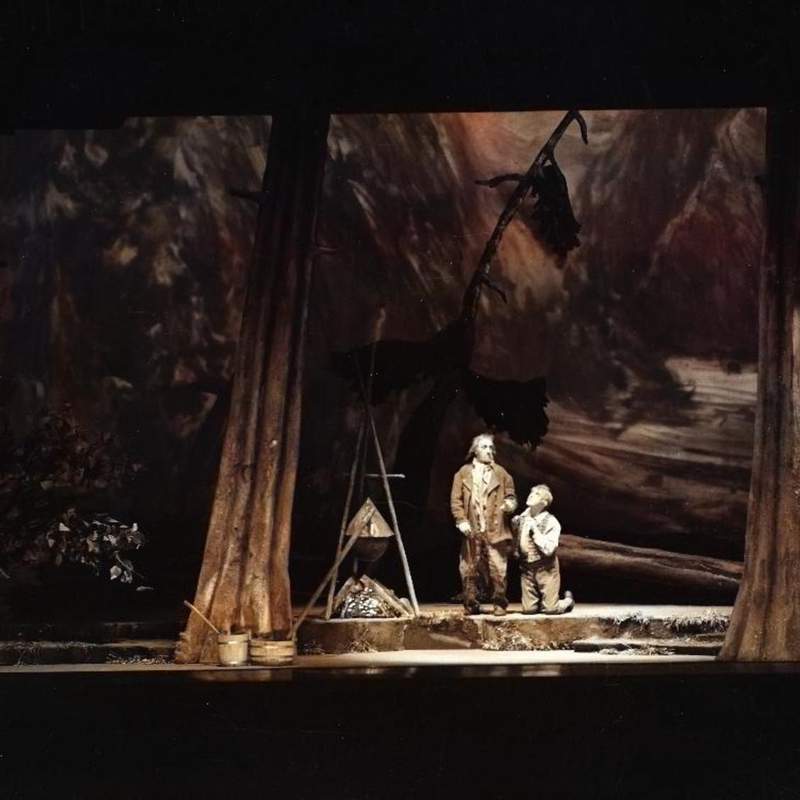
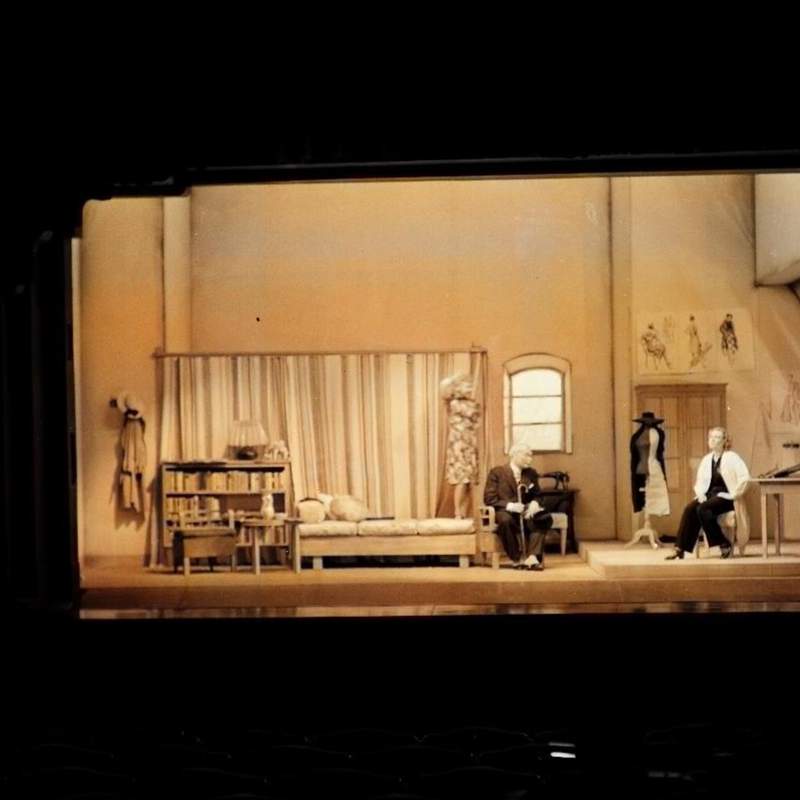
Linked Stage Graph is a Knowledge Graph developed during the Coding da Vinci Süd 2019 hackathon. The graph is being created using a dataset by the National Archive of Baden-Wuerttemberg. It contains black and white photographs and metadata about the Stuttgart State Theatre from the 1890s to the 1940s.
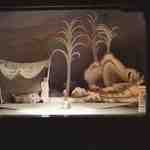
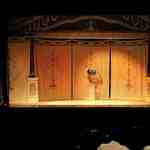
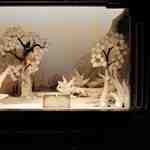
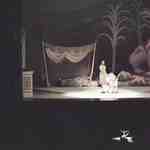
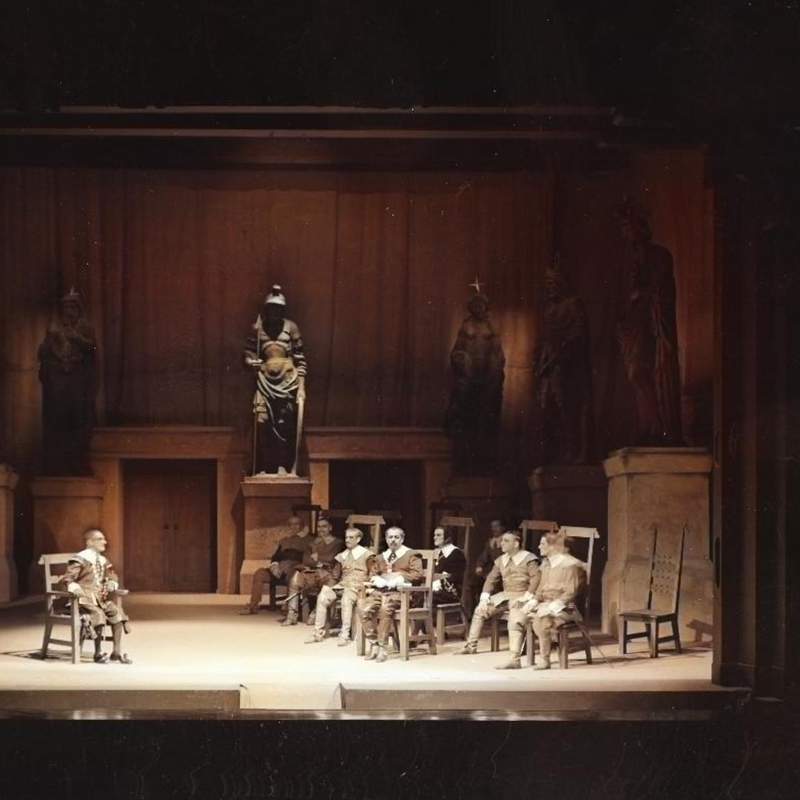
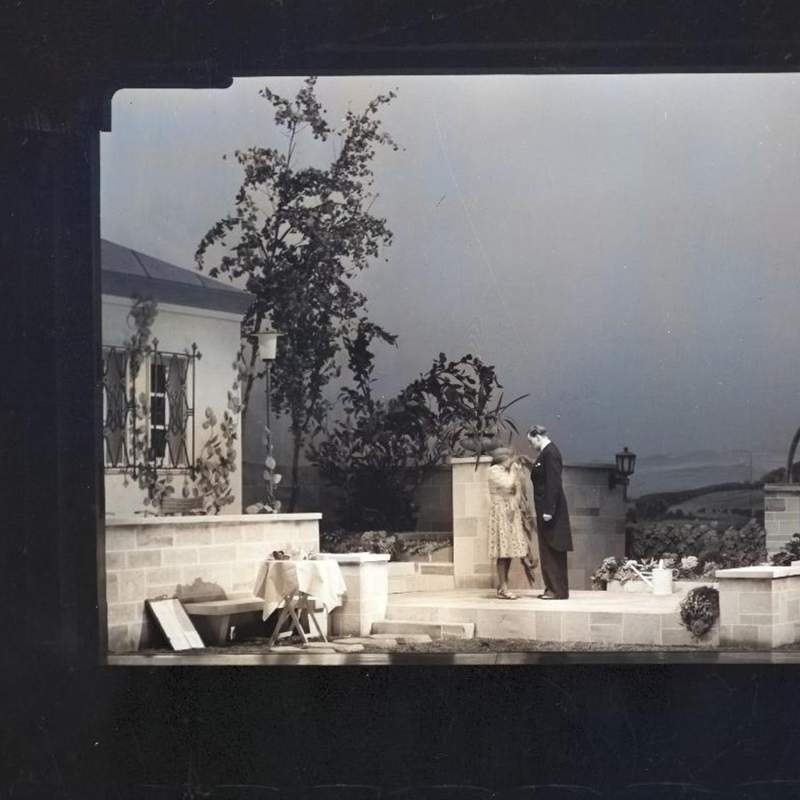
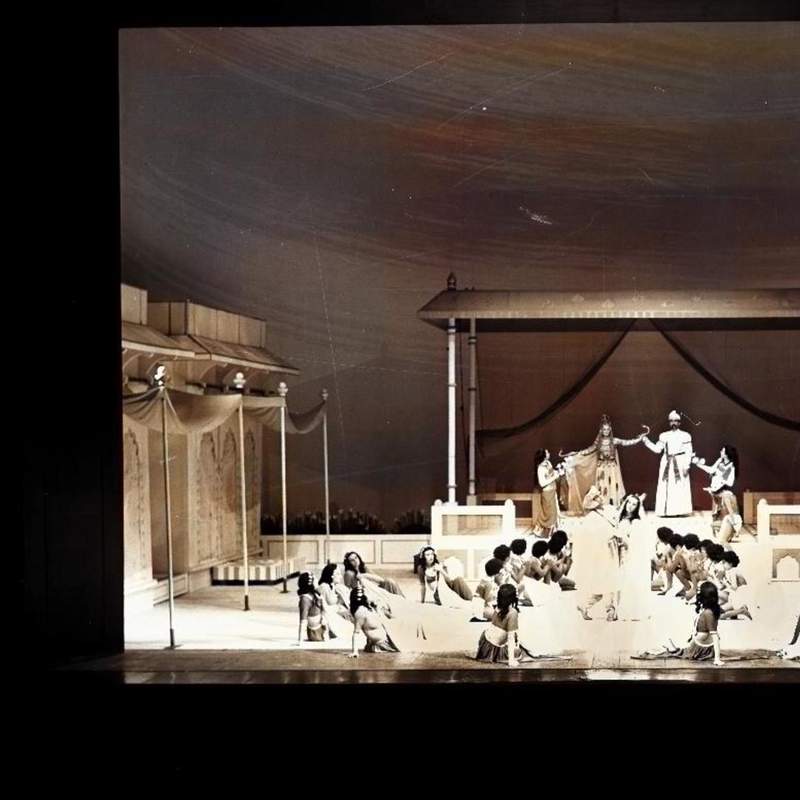
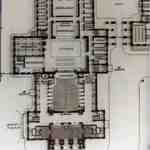
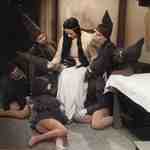
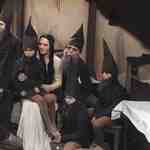
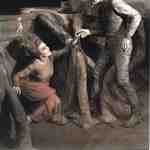
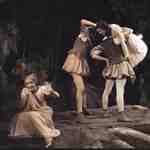
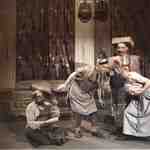
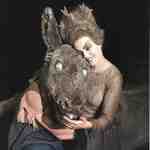
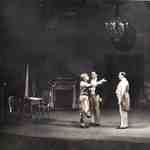
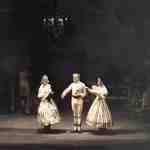
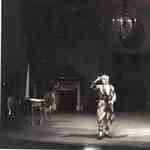
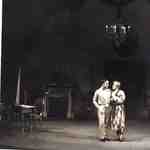
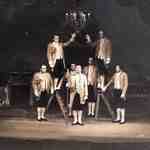
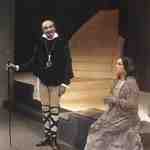
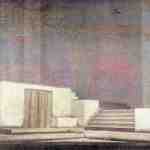
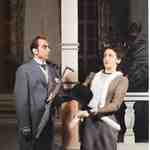
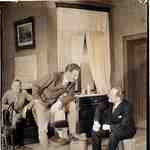
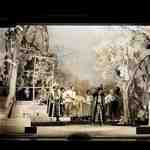
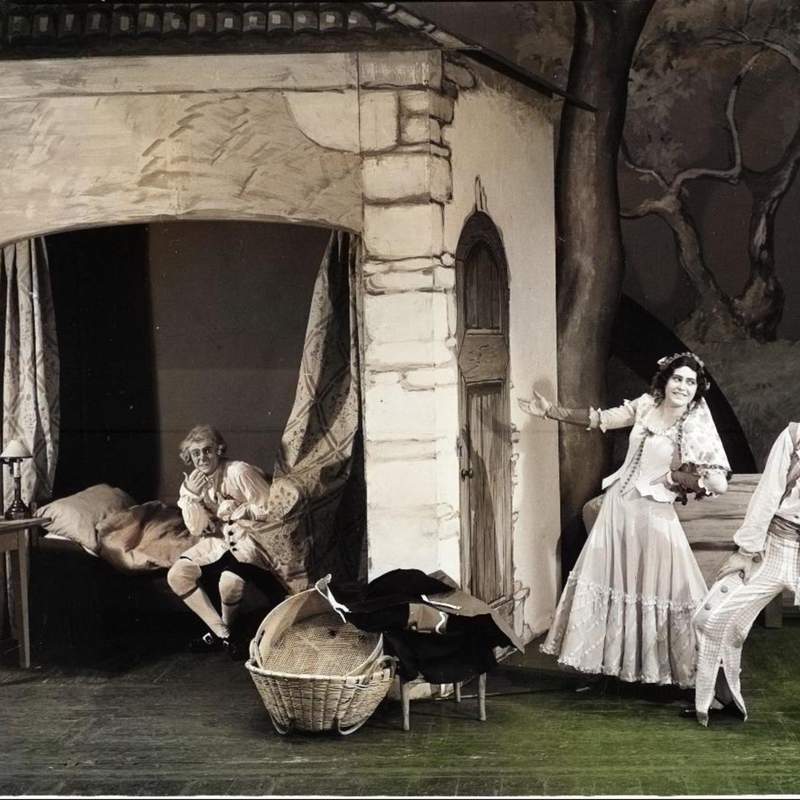
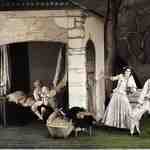
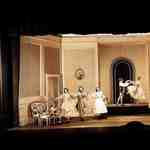
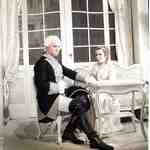
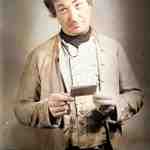
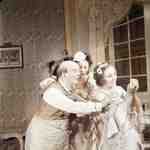
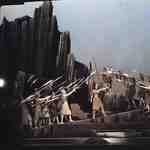
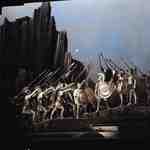
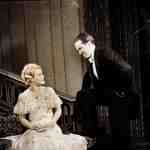
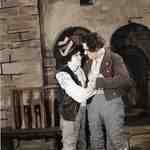
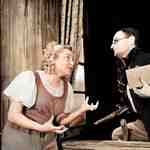
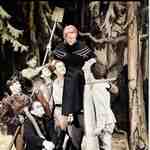
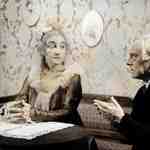
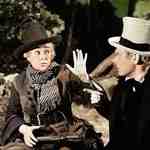
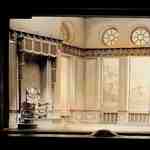
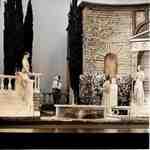
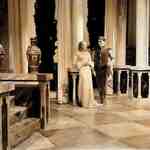
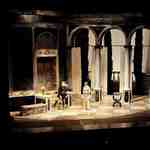
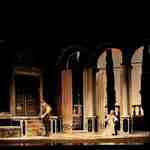
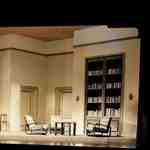
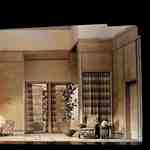
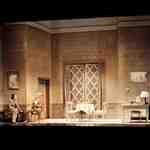
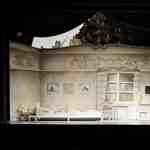
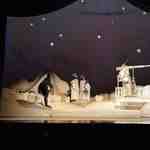
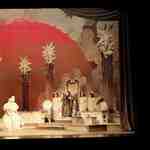
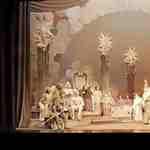
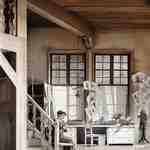
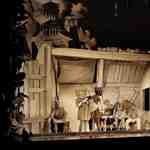
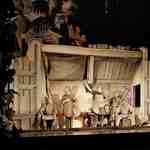
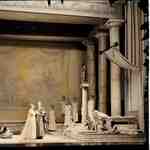
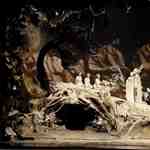
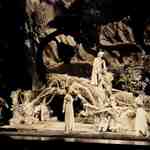
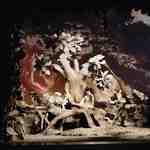
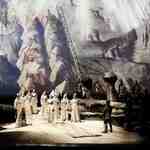
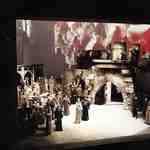
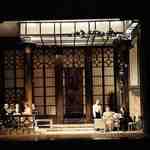
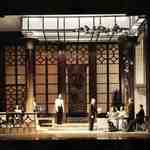
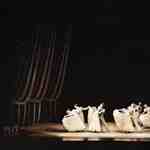
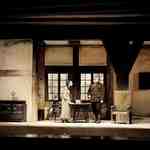
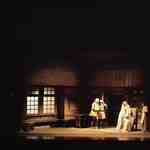
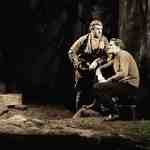
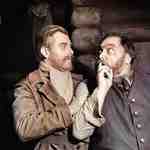
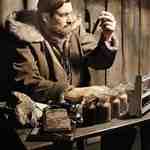
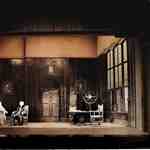
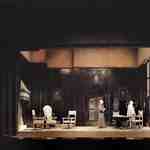
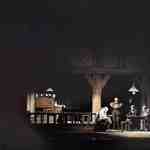
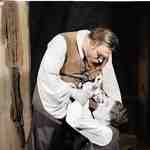
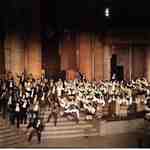
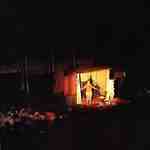
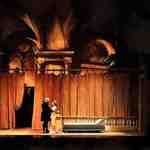
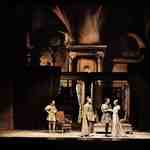
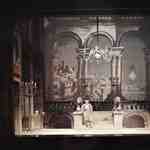
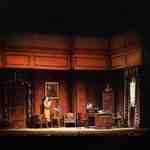
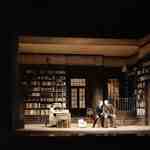
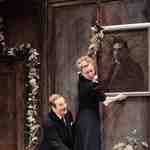
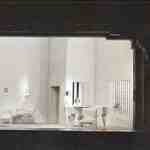
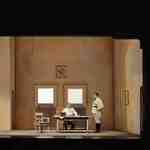
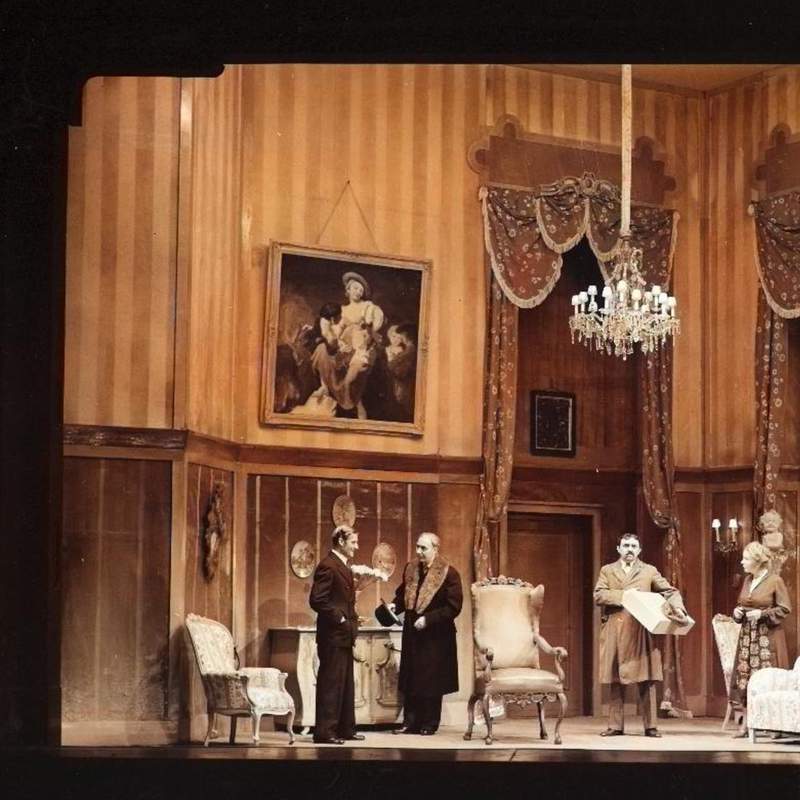
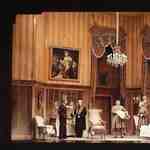
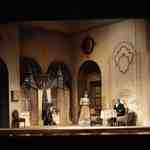
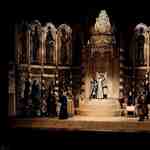
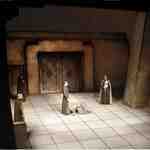
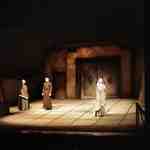
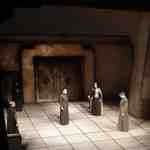
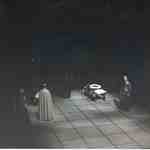
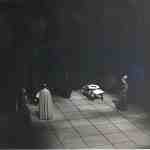
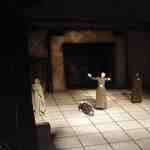
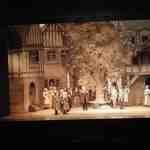
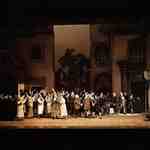
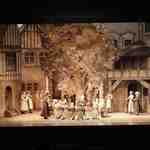
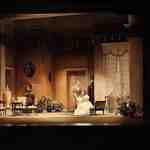
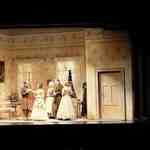
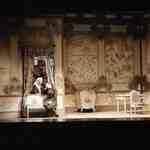
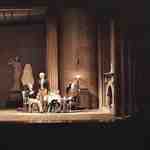
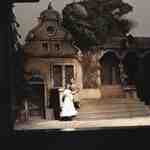
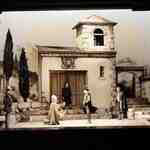
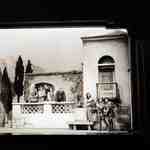
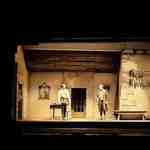
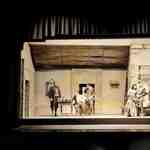
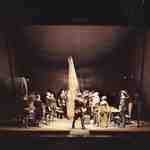
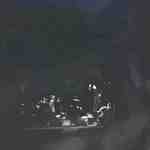
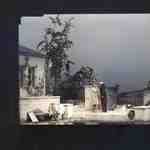
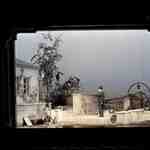
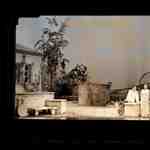
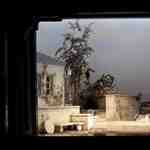
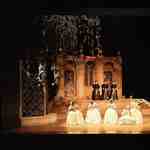
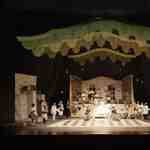
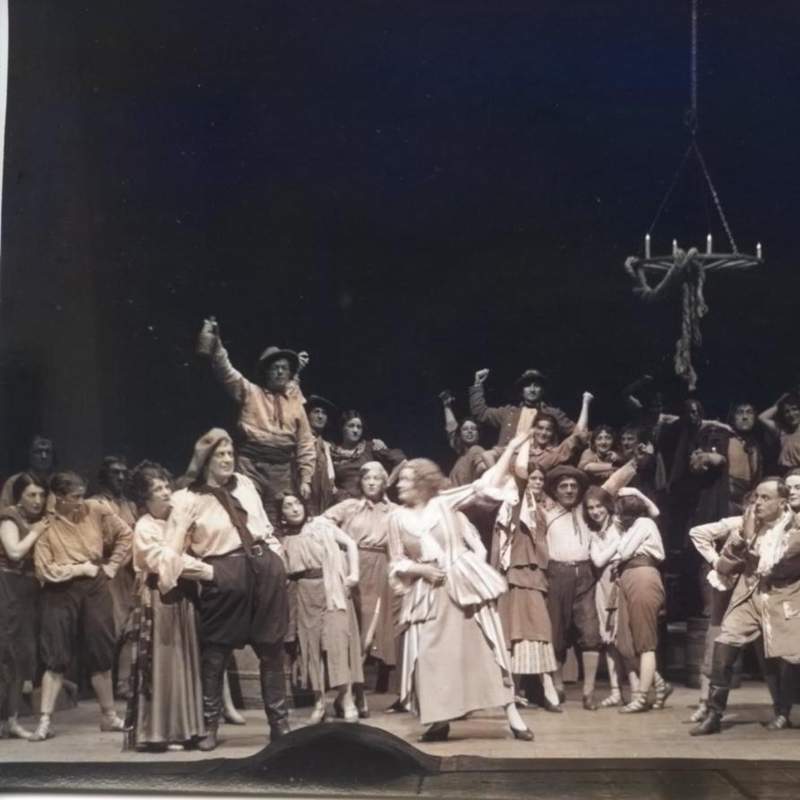
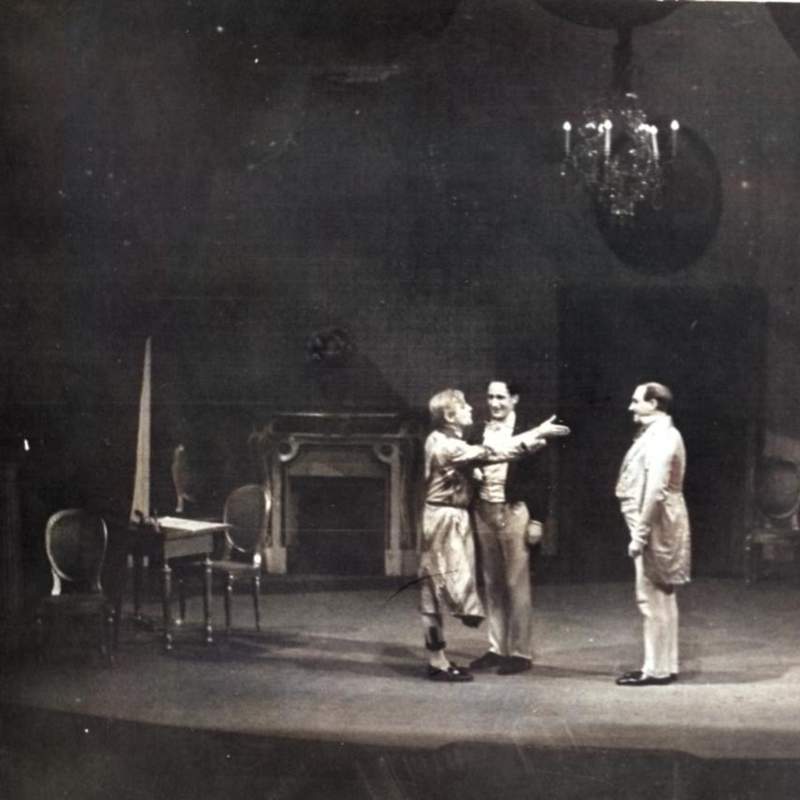
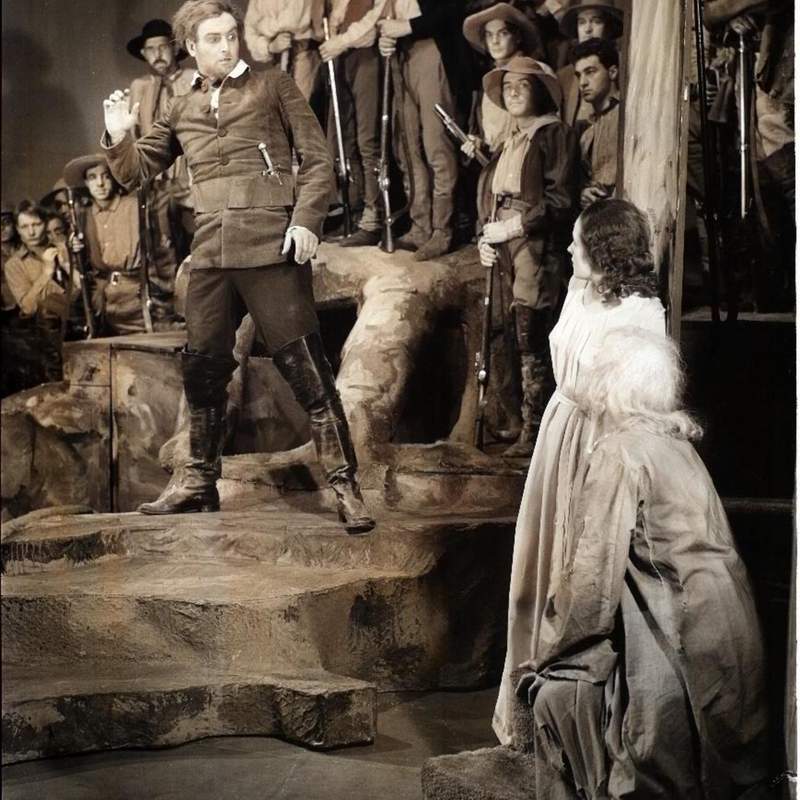
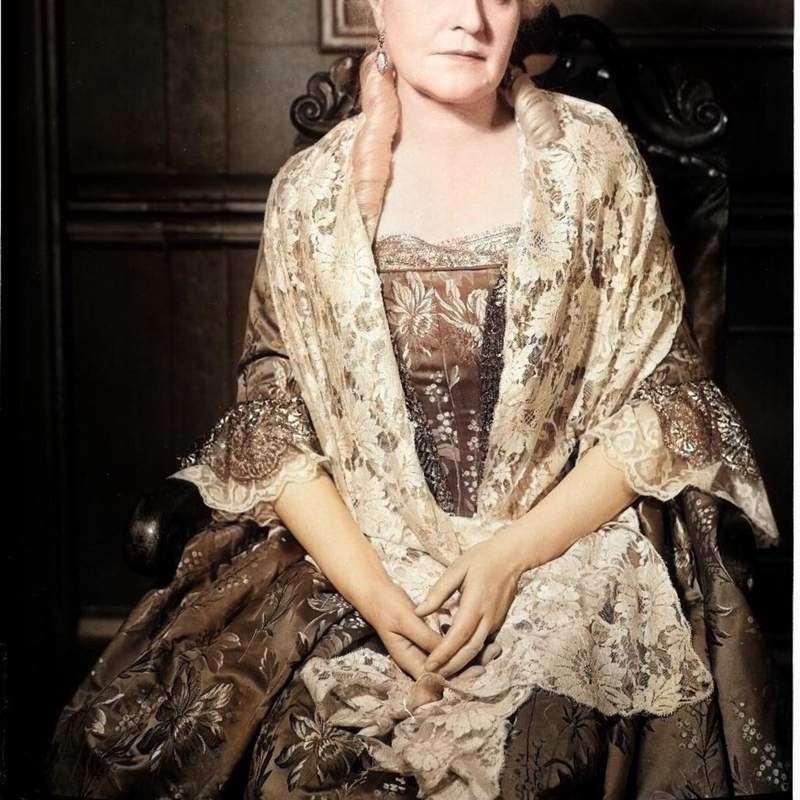
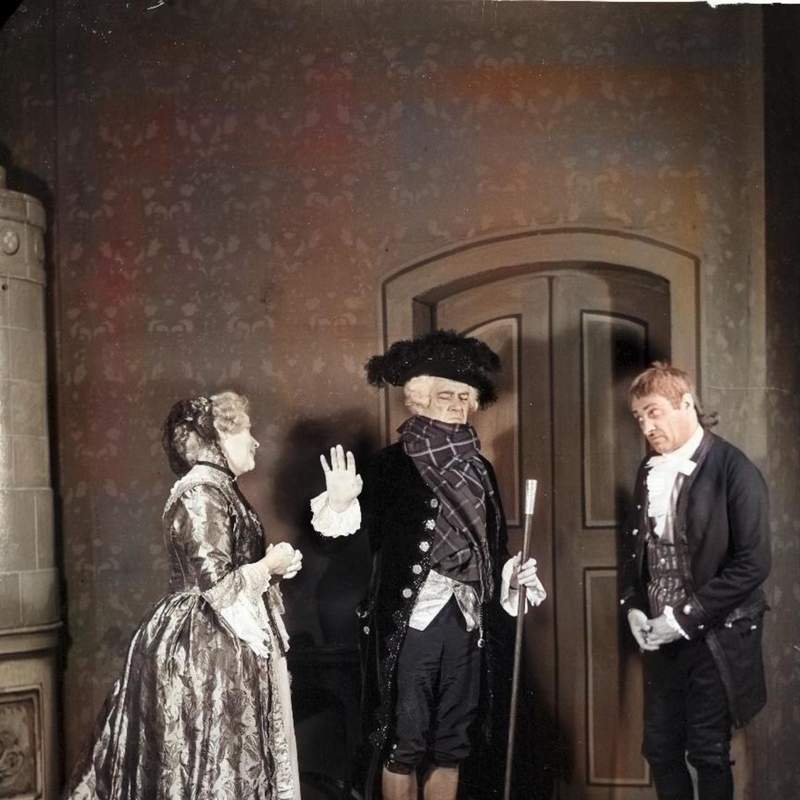
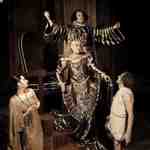
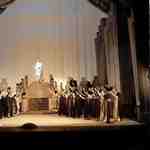
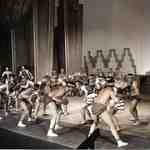
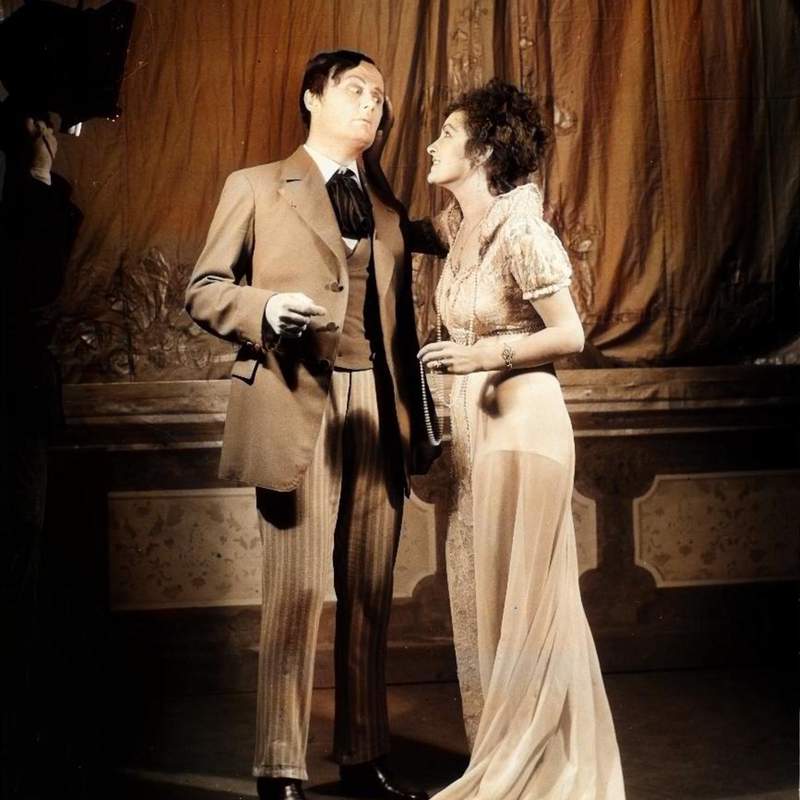
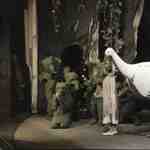
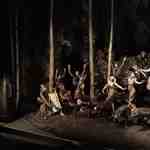
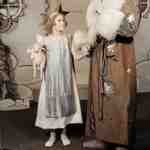
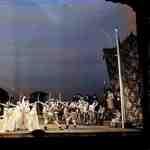
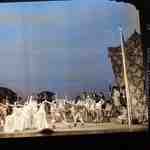
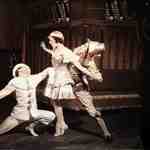
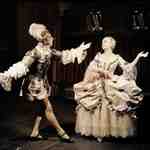
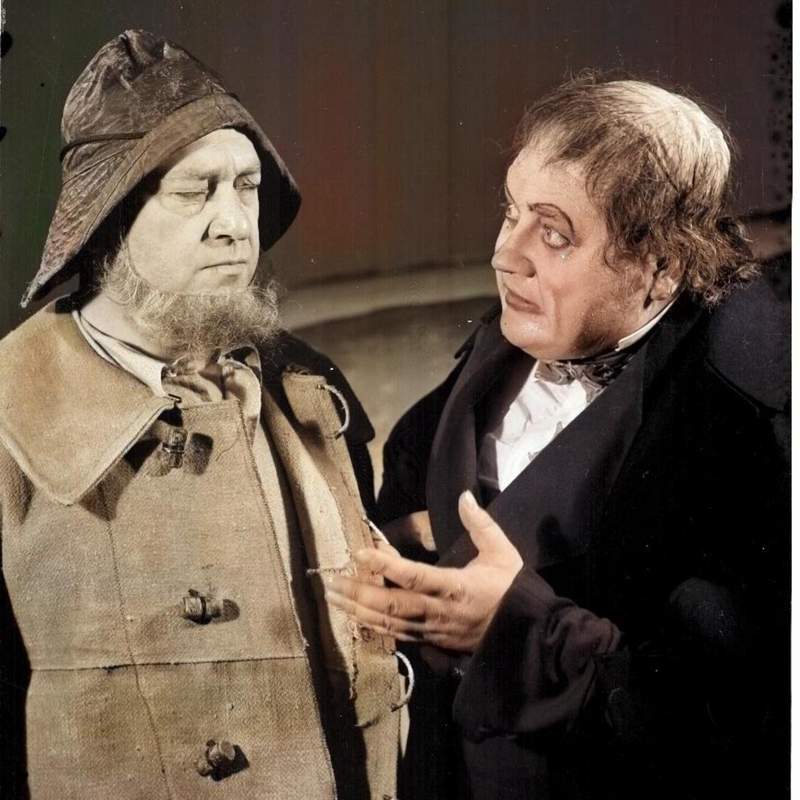
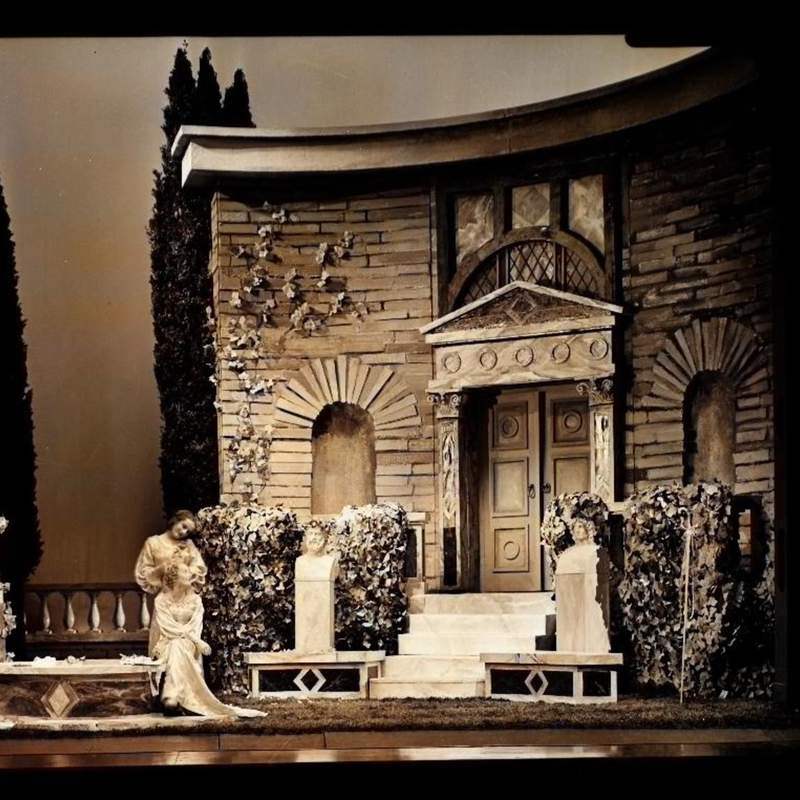
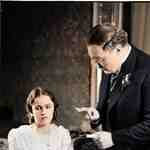
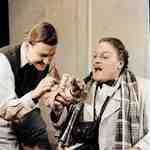
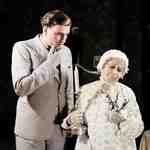
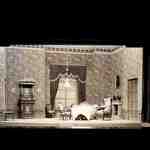
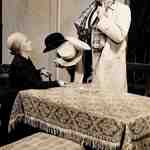
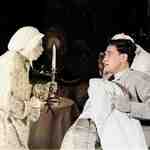
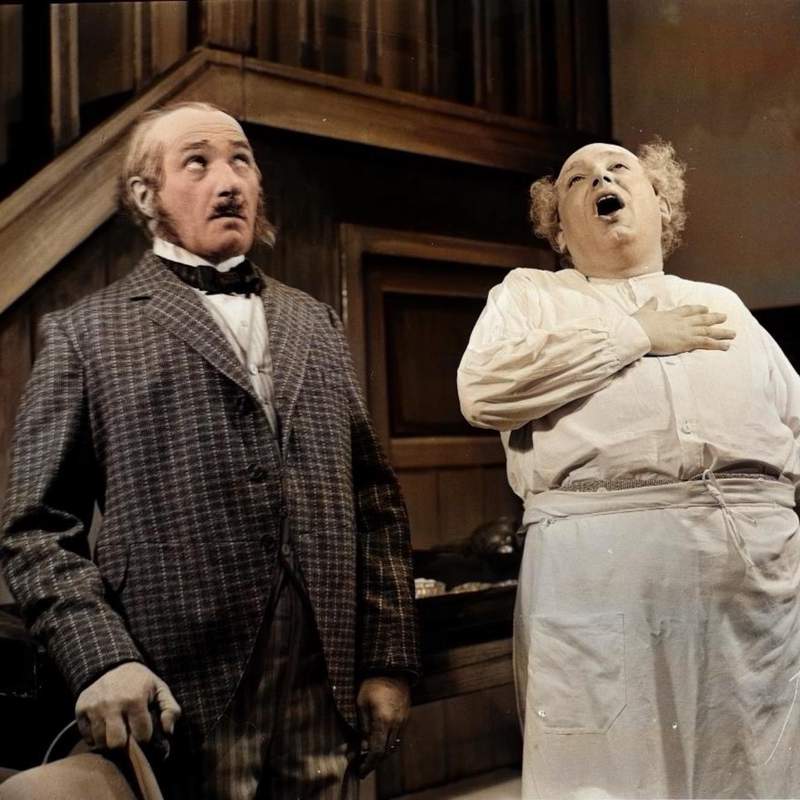
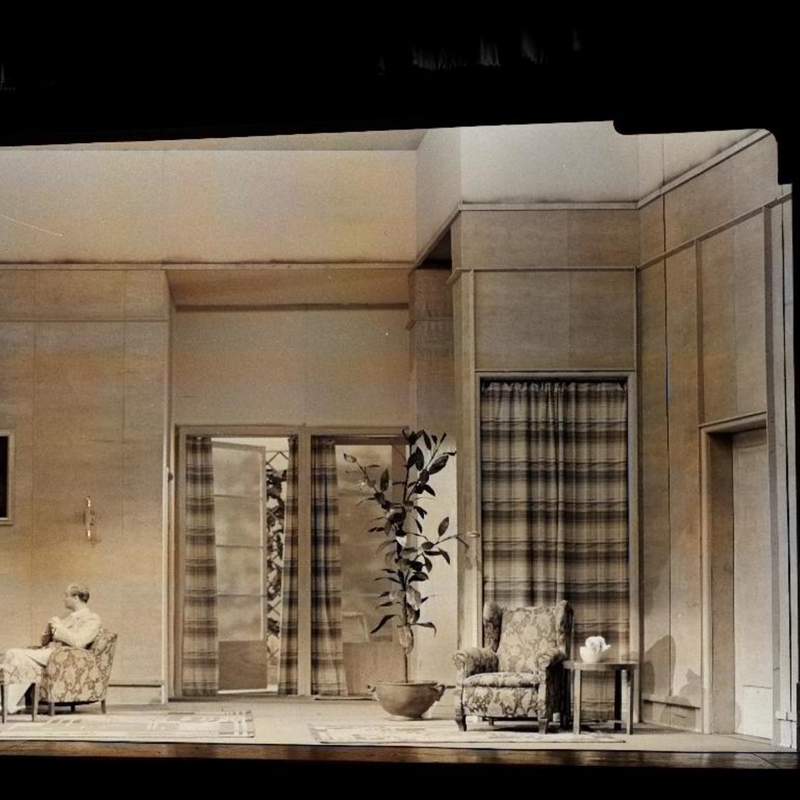
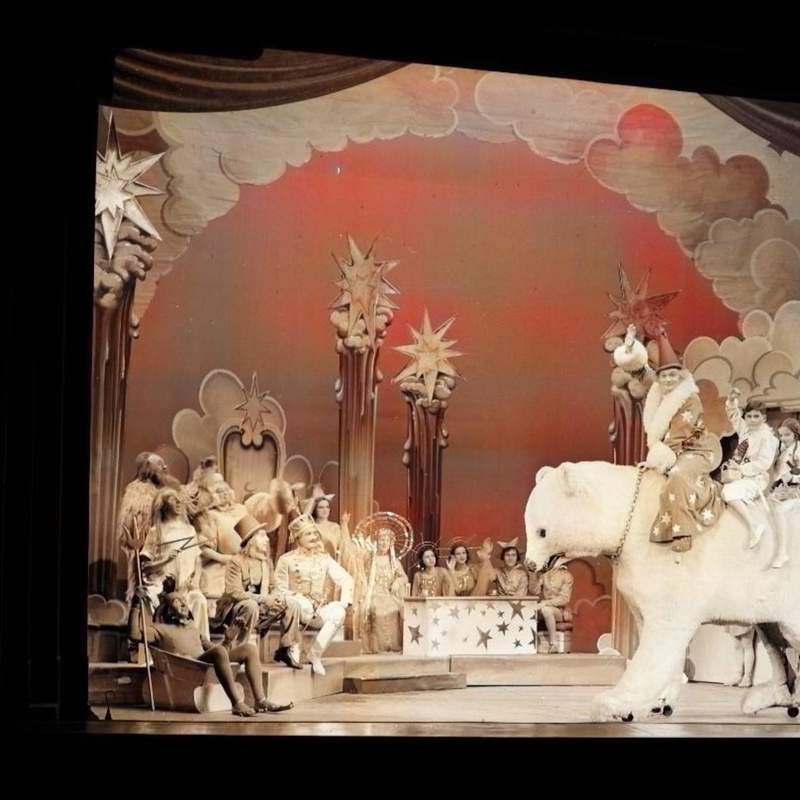
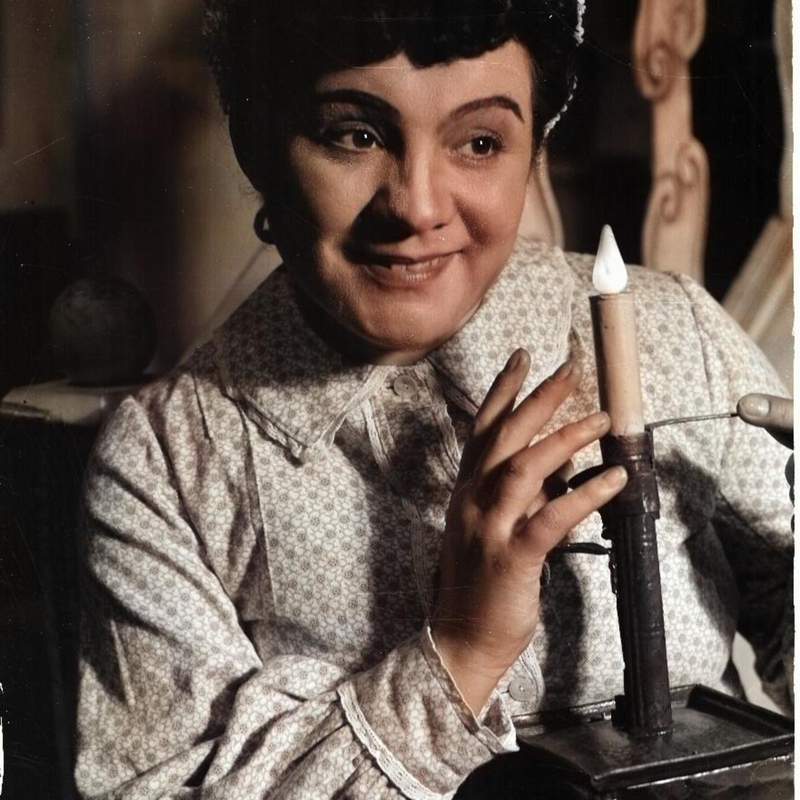
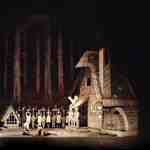
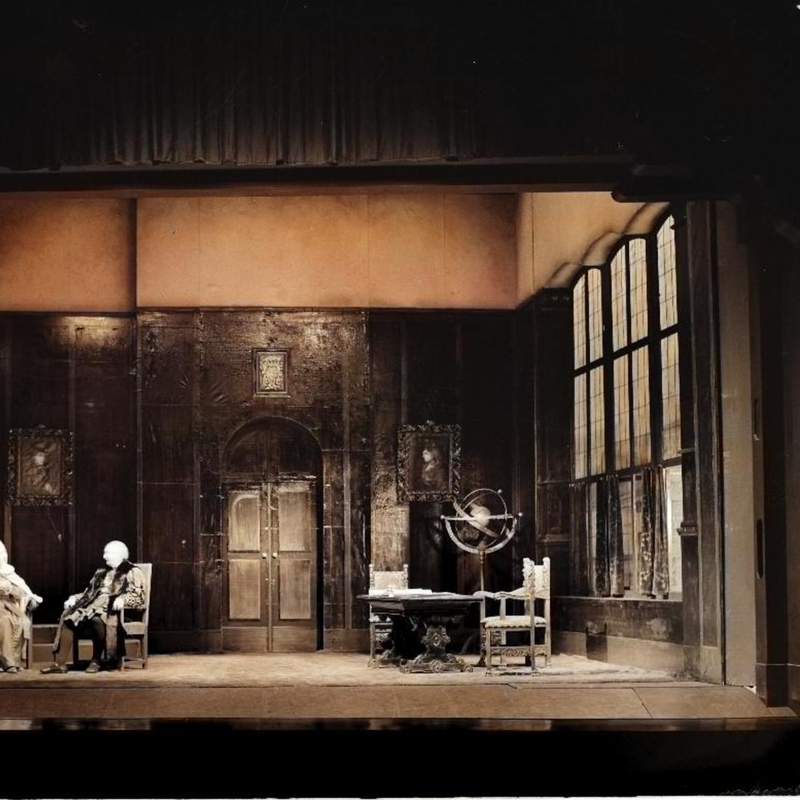
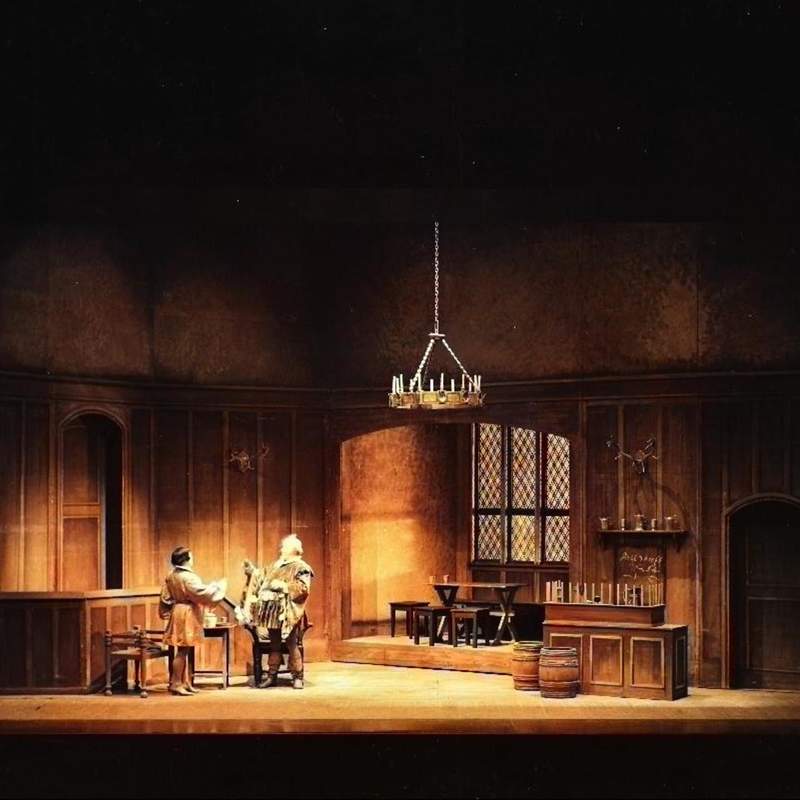
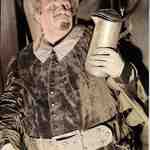
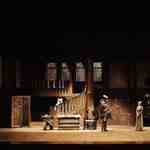
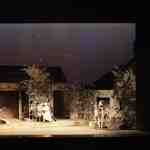
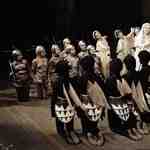
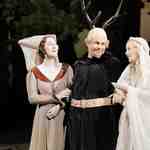
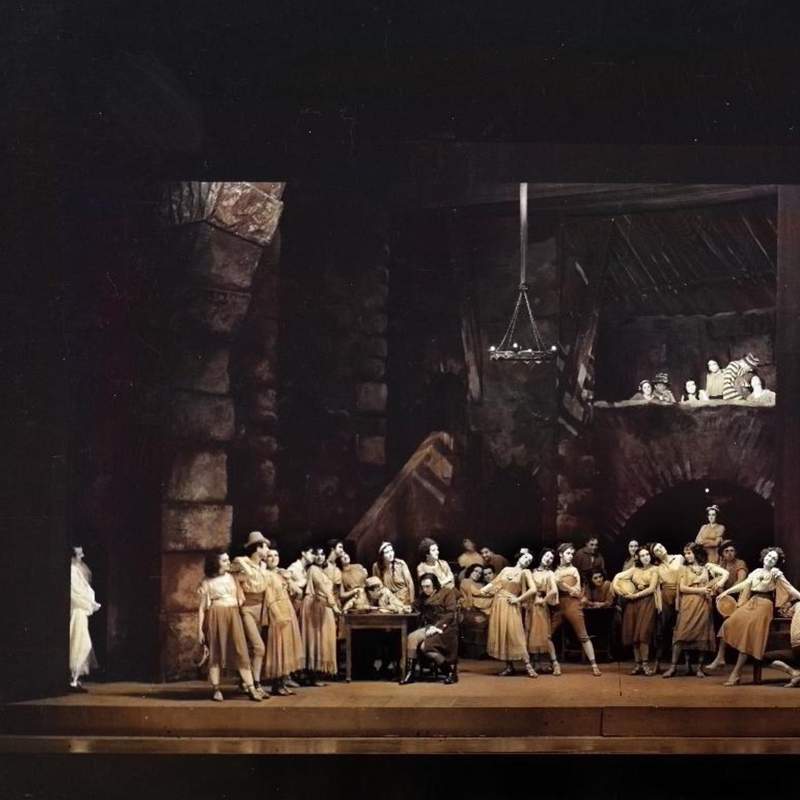
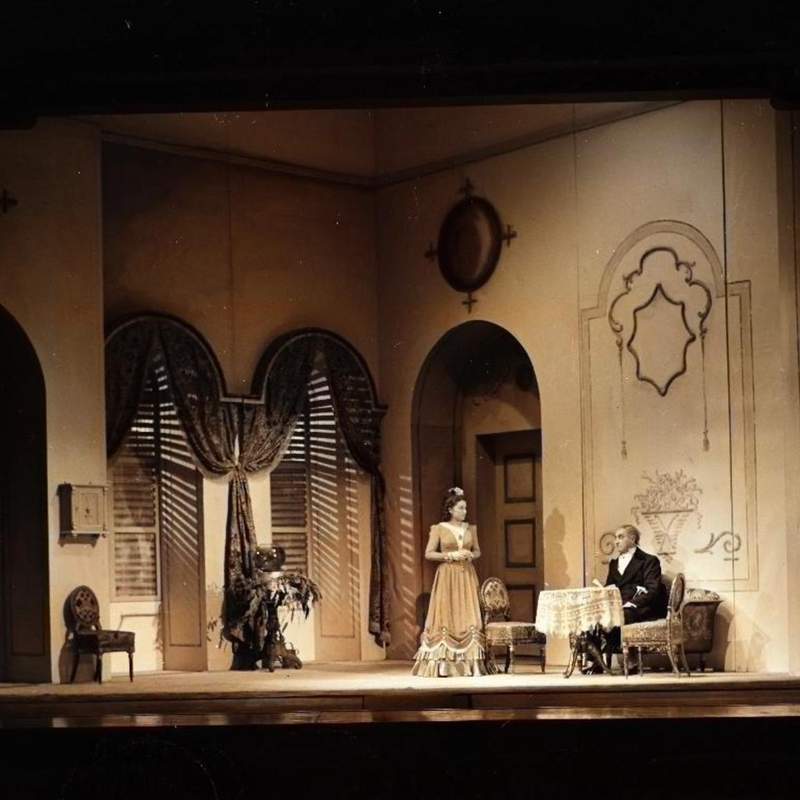
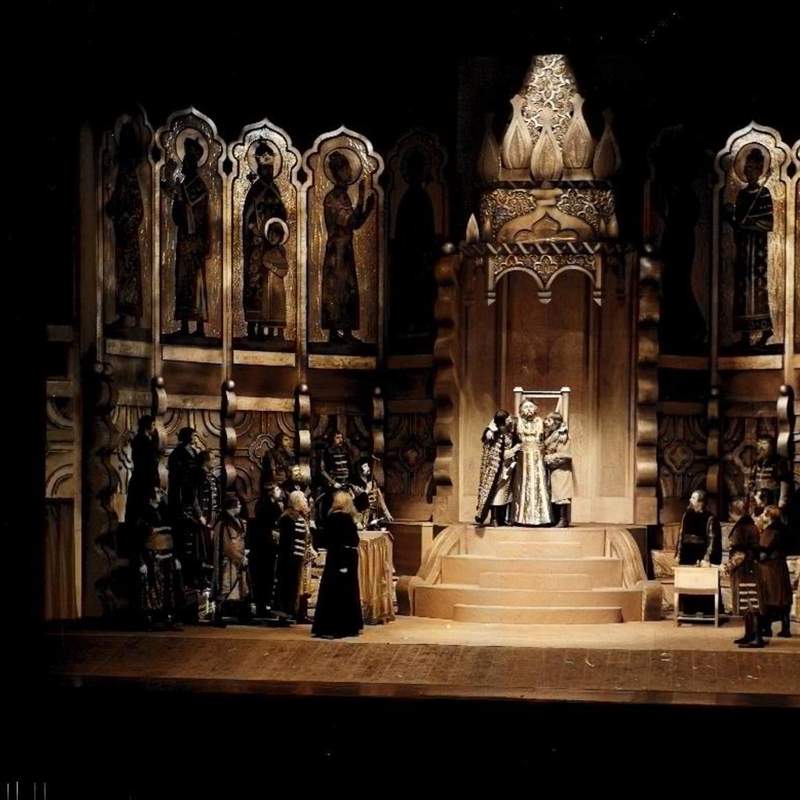
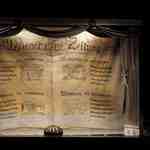
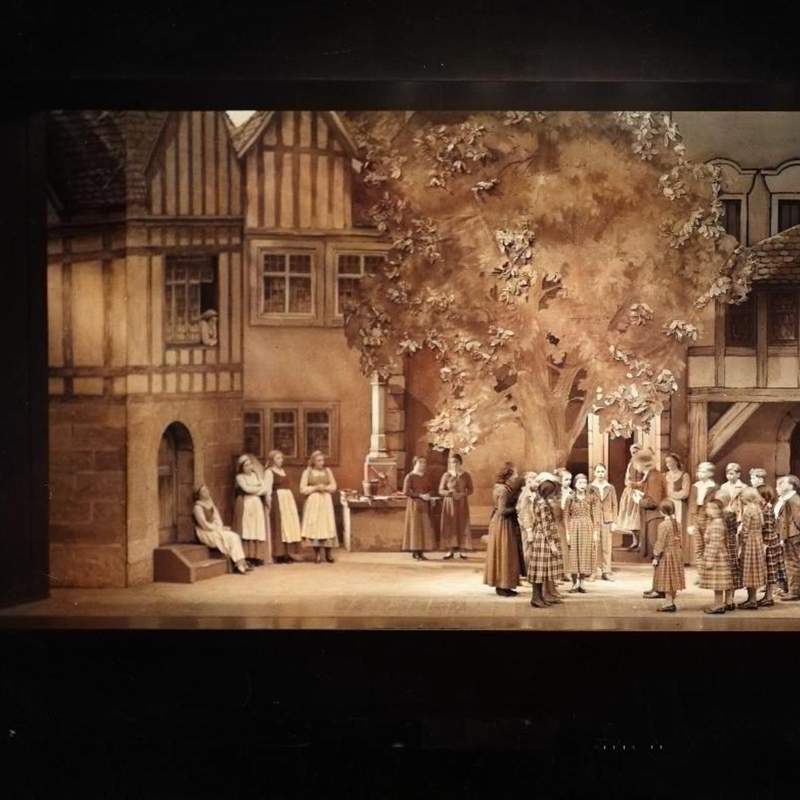
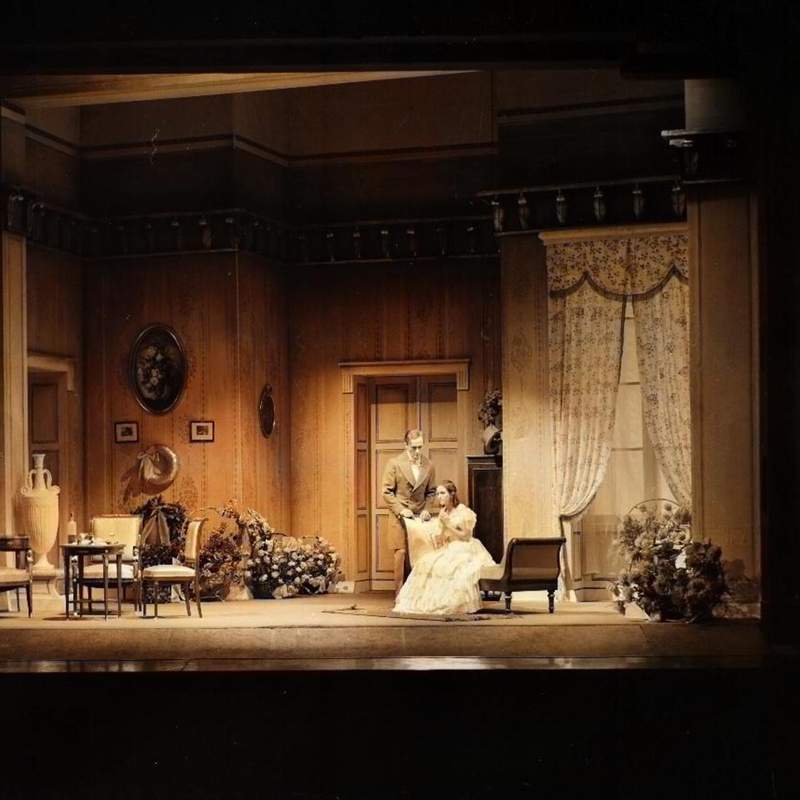
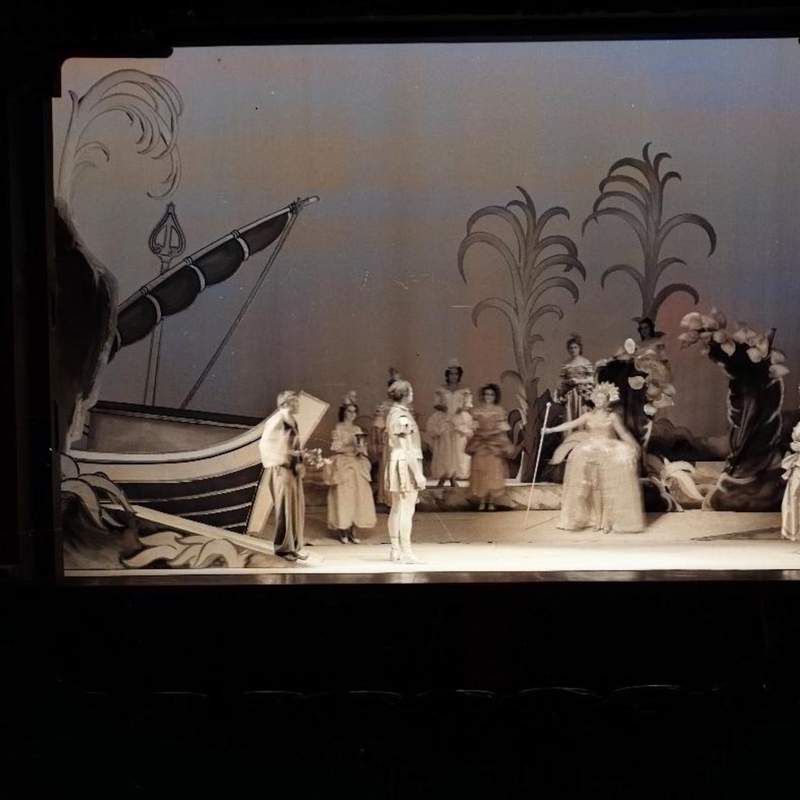
The nearly 7.000 photographs give vivid insights into on-stage events like theater plays, operas and ballet performances as well as off-stage moments and theater buildings. However, the images and the data set as they are currently organized are hard to use and explore for anyone who is unfamiliar with an achive’s logic to structure information.
This project proposes means to explore and understand the data by humans and machines using linked data and interesting visualizations.
See who has been working on this
Explore the photographs and metadata using the Vikus Viewer
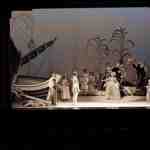
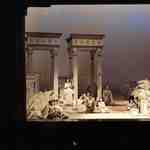
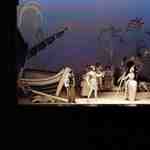
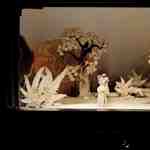
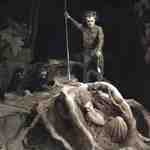
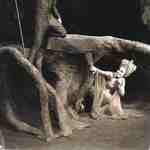
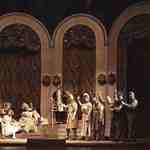
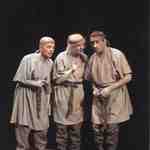
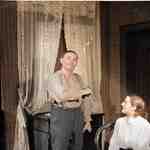
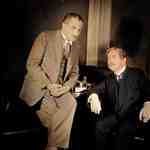
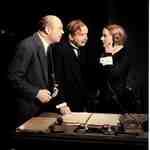
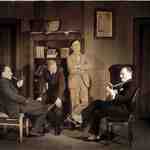
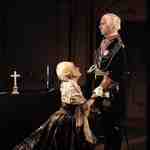
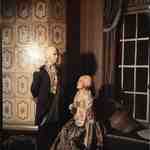
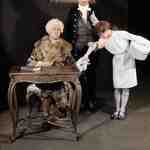
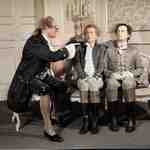
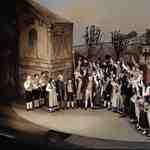
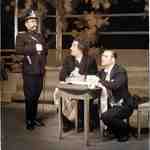
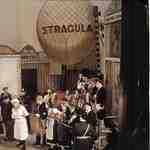
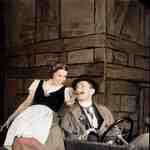
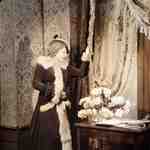
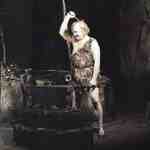
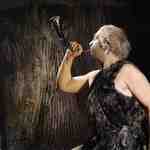
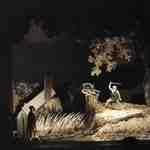
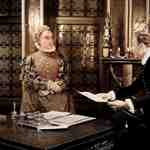
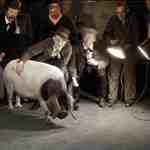
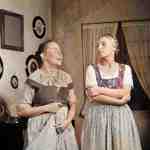
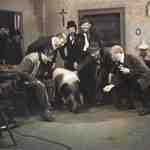
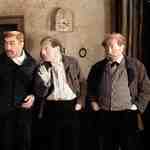
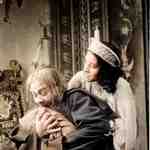
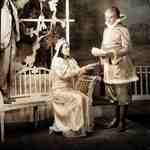
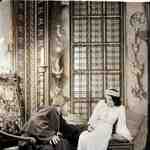
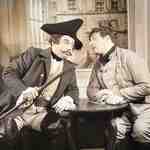
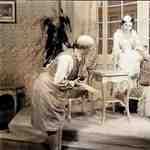
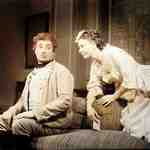
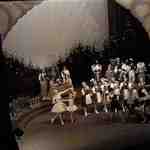
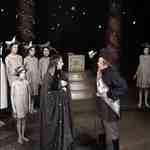
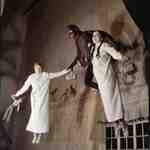
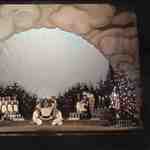
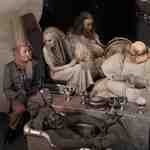
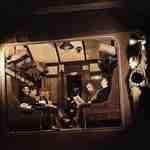
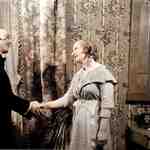
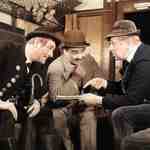
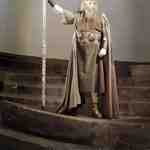
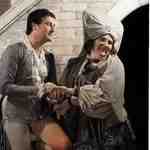
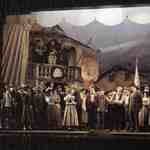
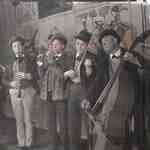
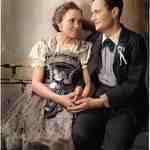
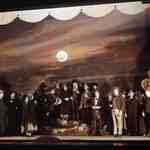
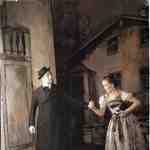
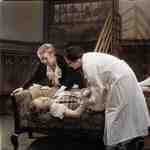
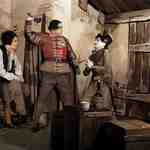
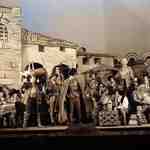
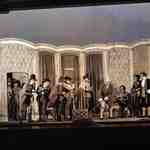
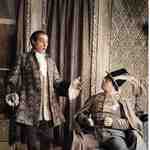
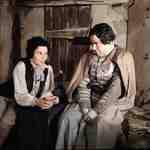
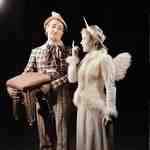
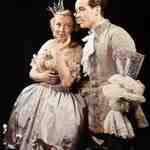
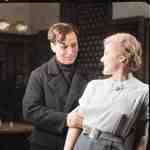
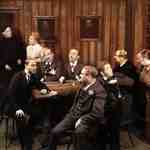
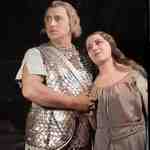
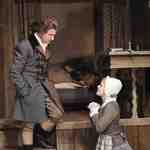
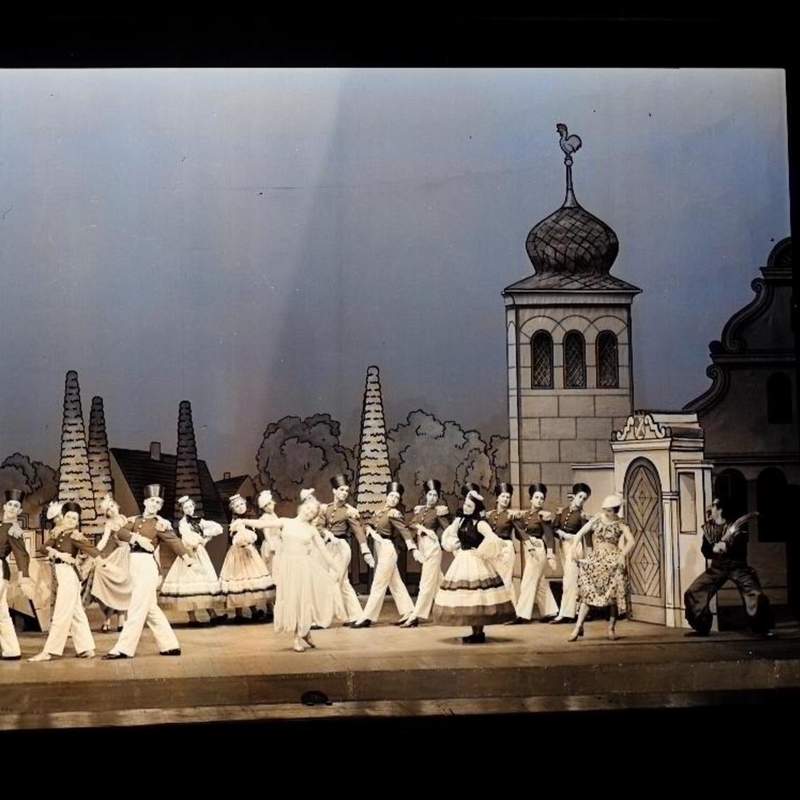
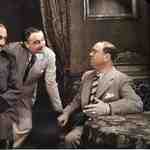
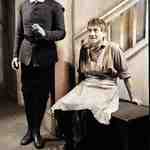
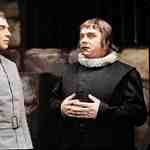
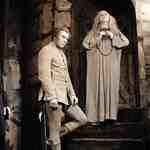
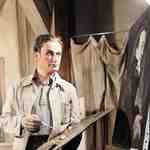
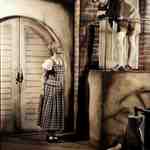
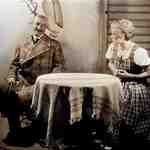
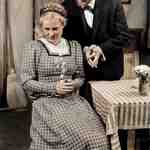
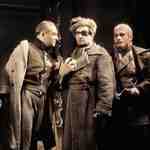
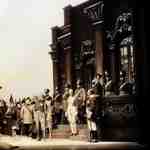
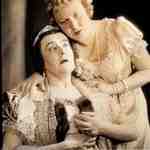
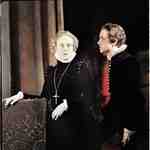
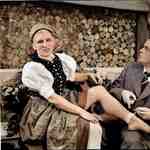
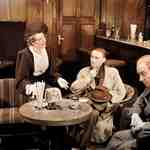
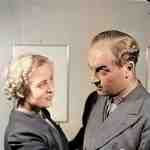
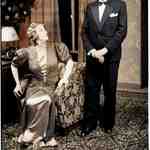
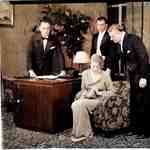
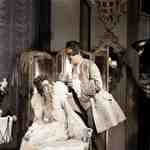
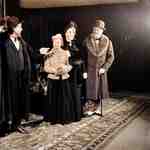
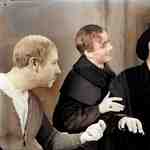
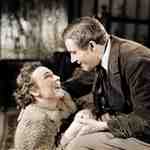
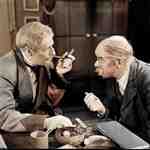
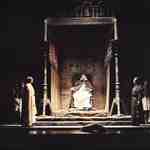
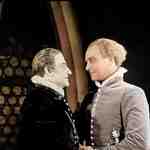
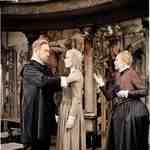
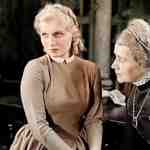
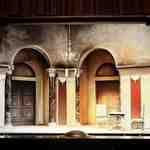
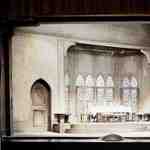
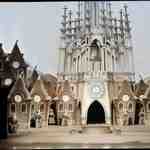
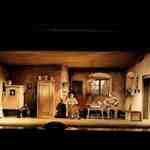
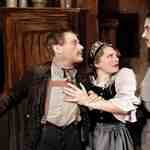
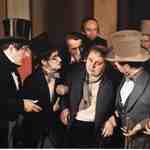
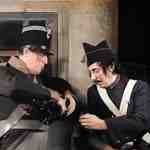
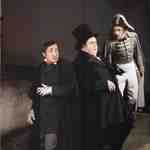
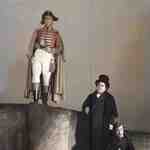
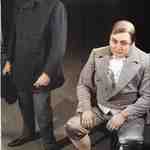
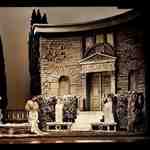
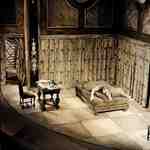
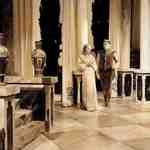
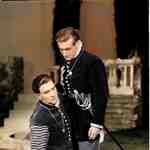
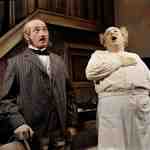
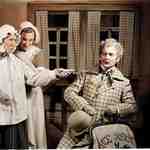
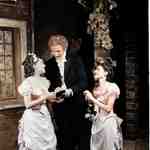
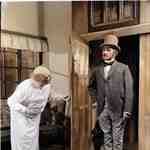
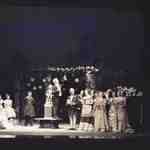
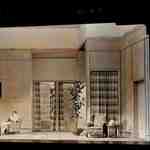
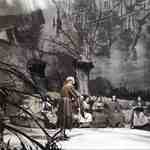
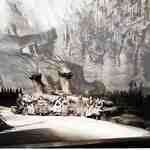
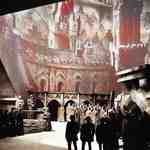
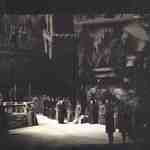
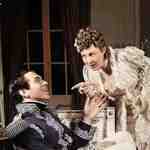
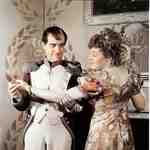
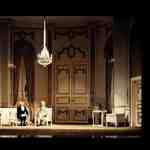
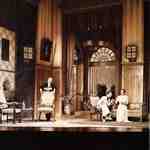
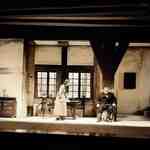
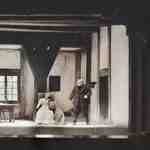
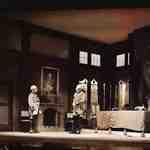
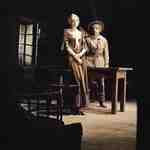
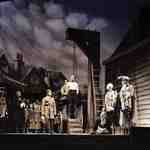
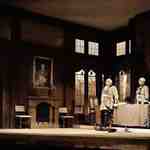
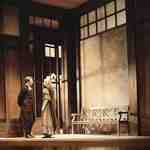
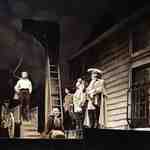
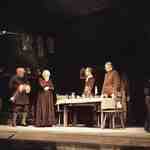
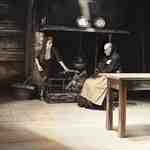
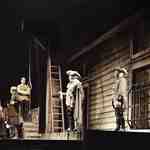
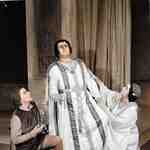
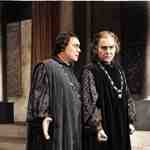
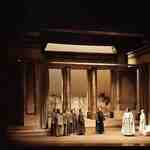
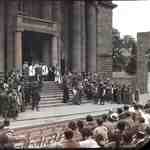
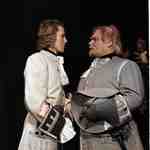
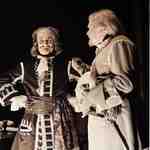
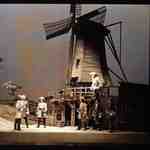
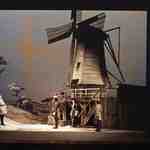
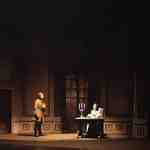
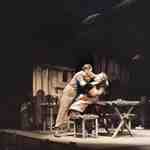
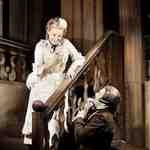
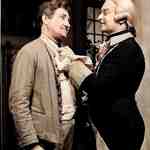
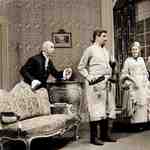
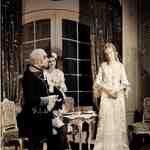
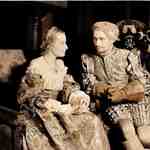
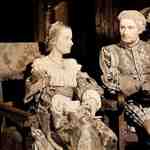
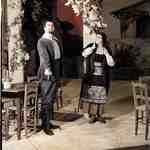
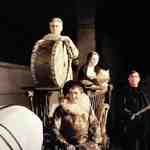
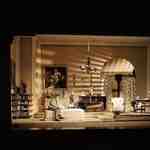
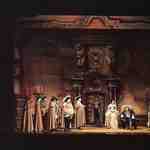
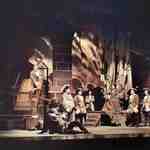
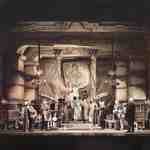
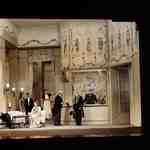
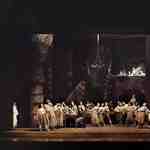
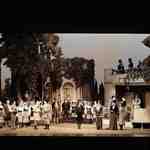
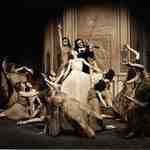
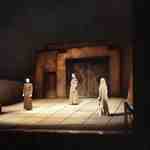
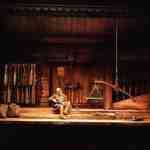
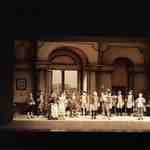
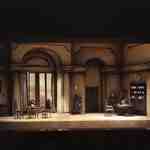
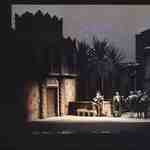
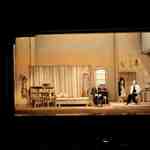
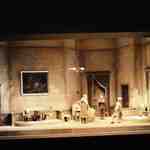
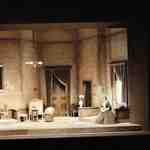
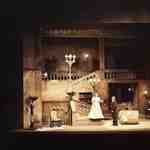
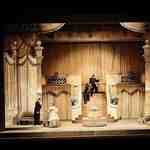
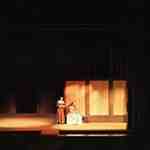
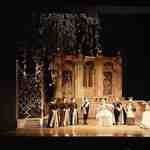
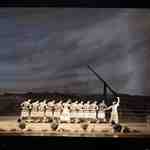
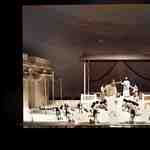
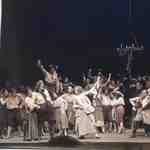
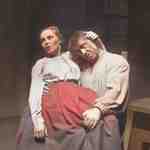
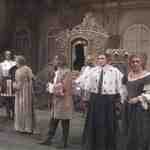
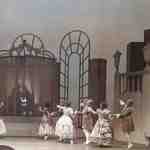
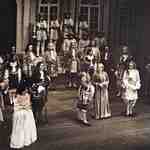
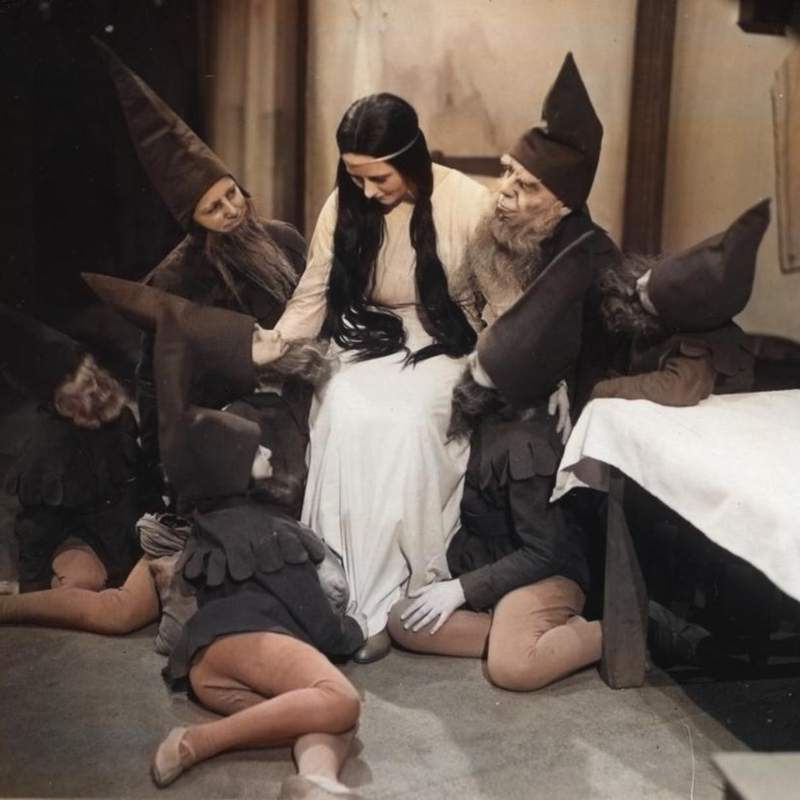
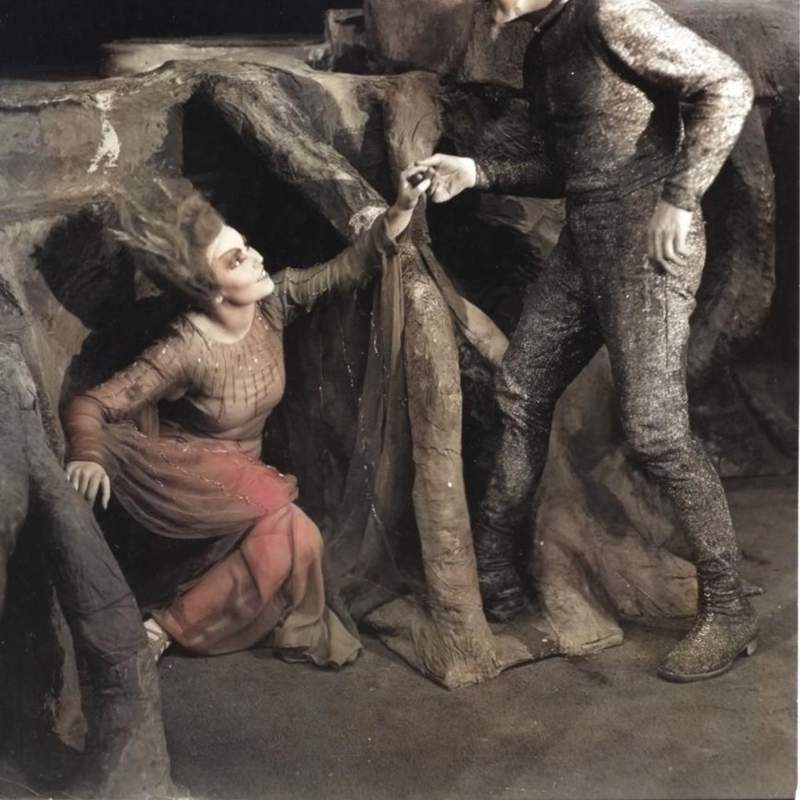
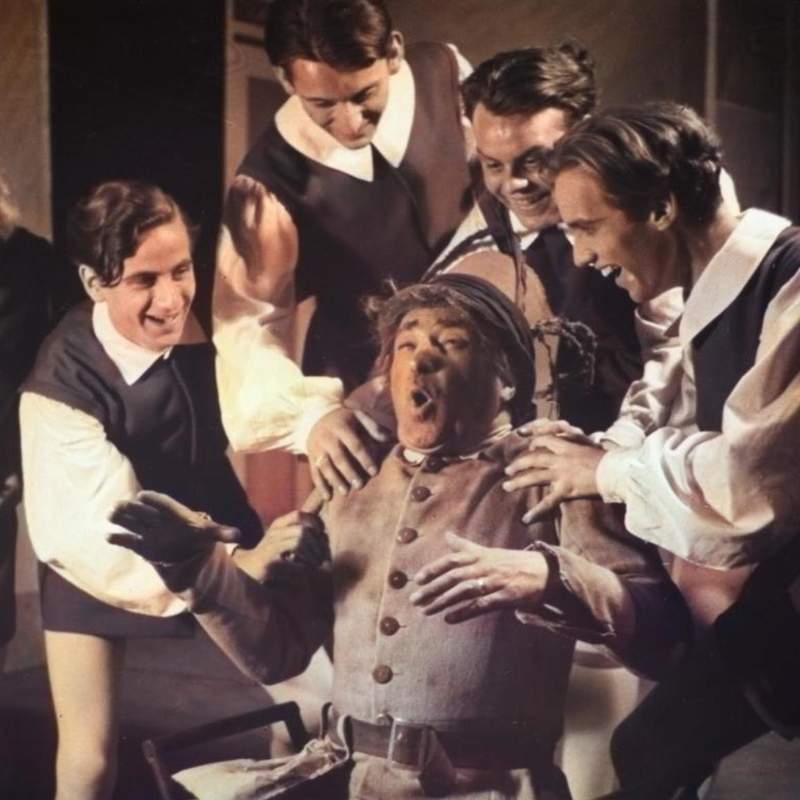
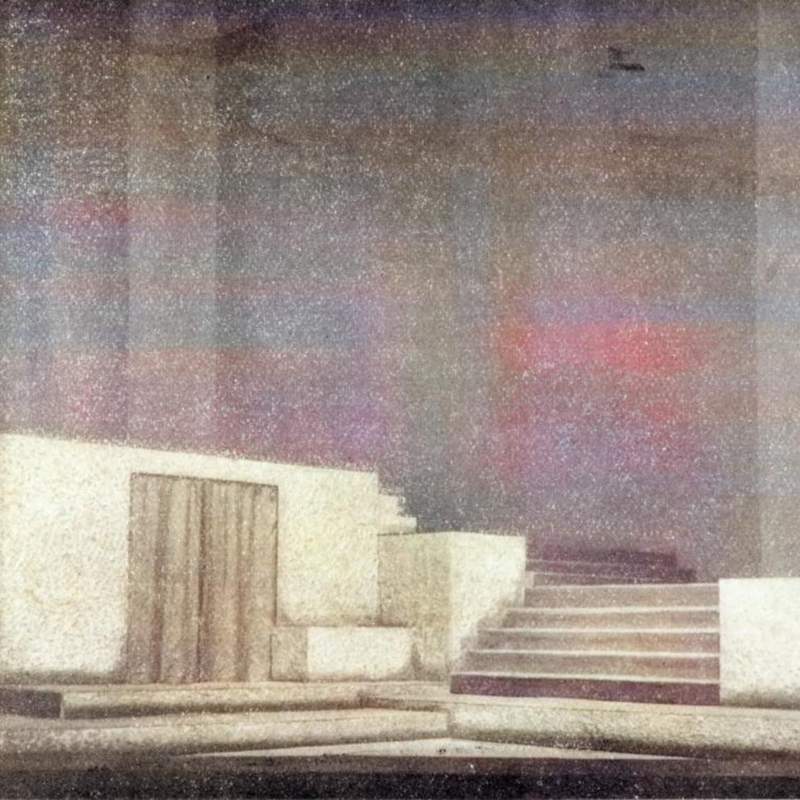
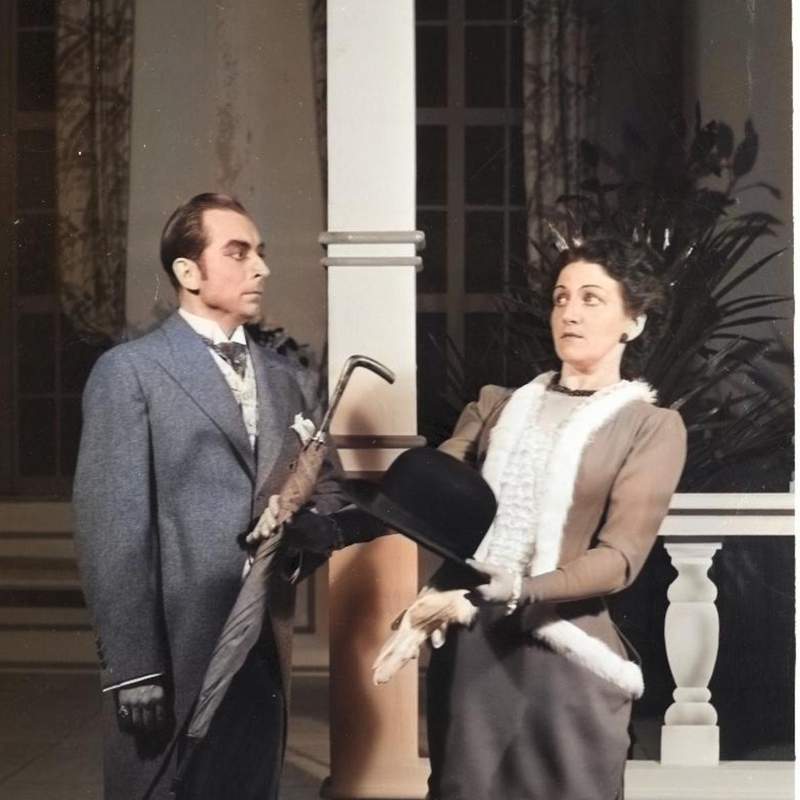
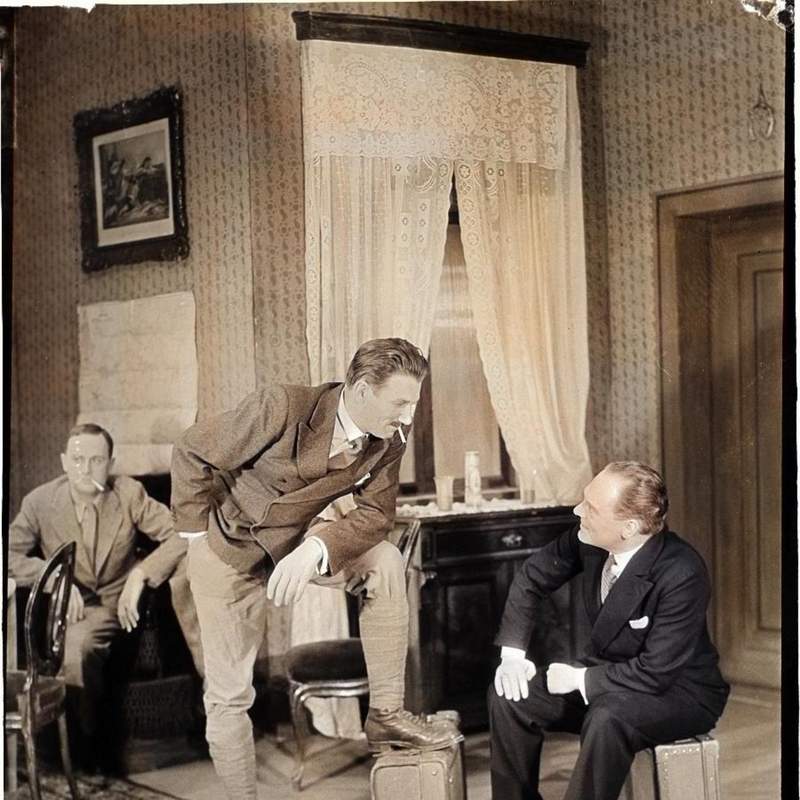
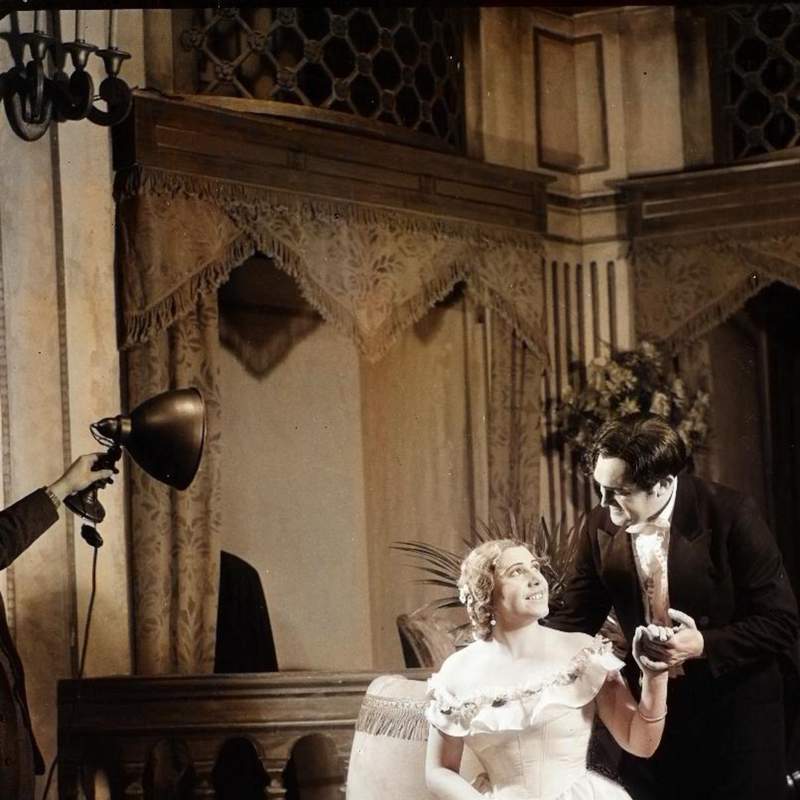
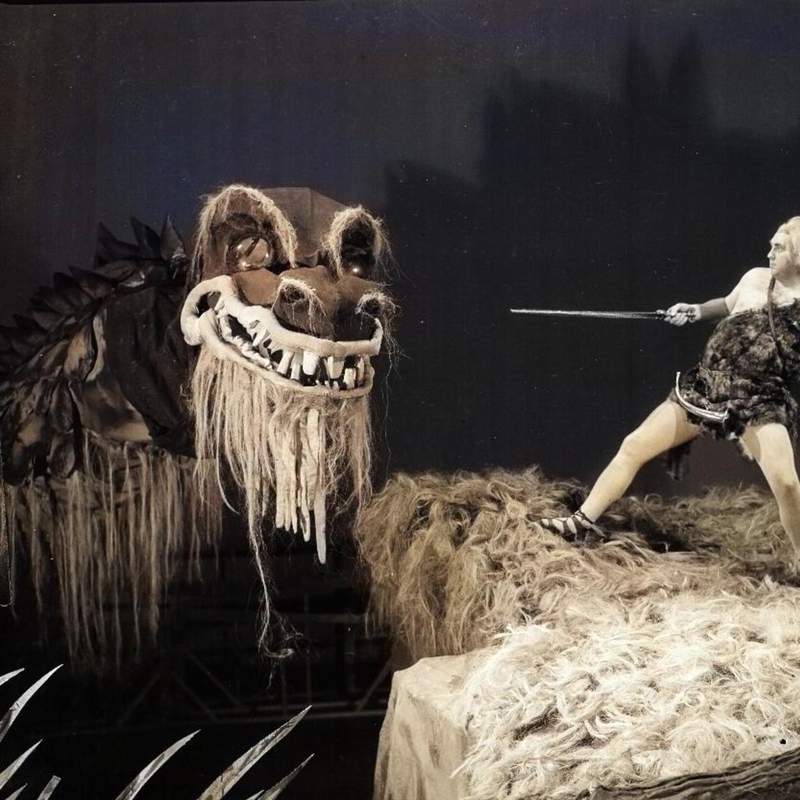
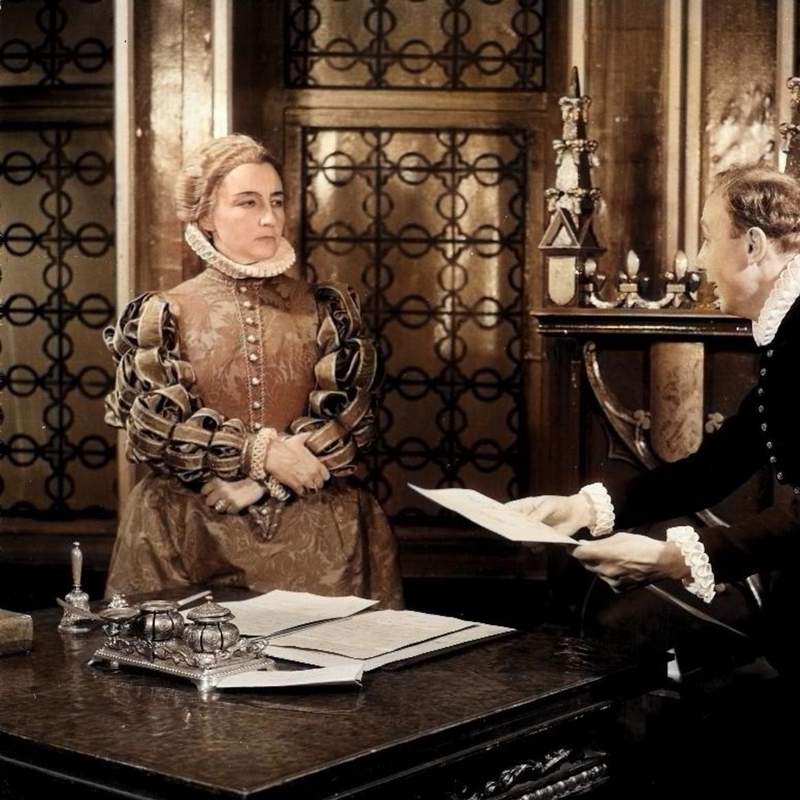
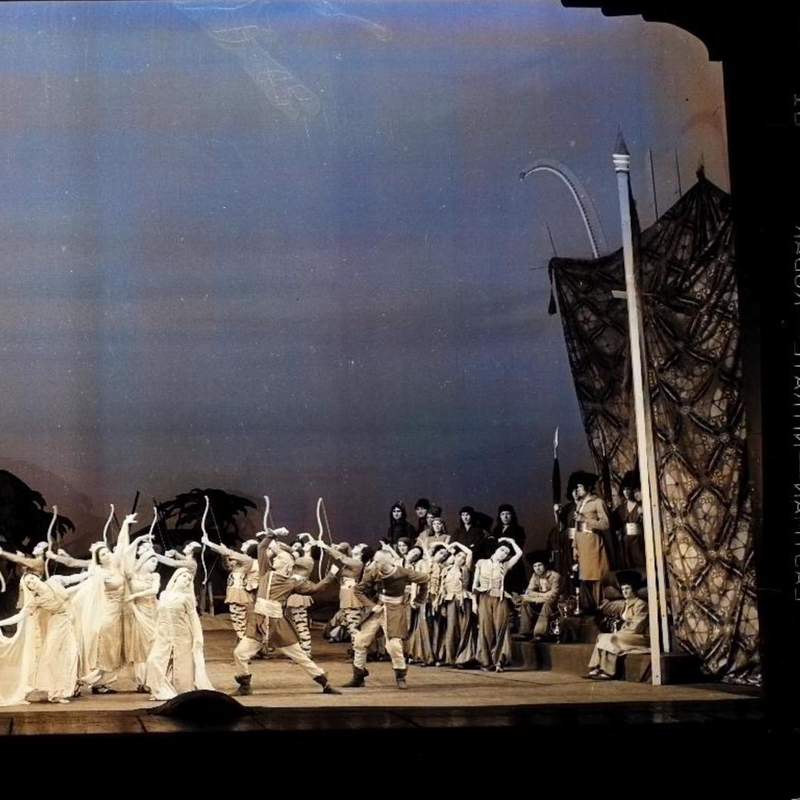
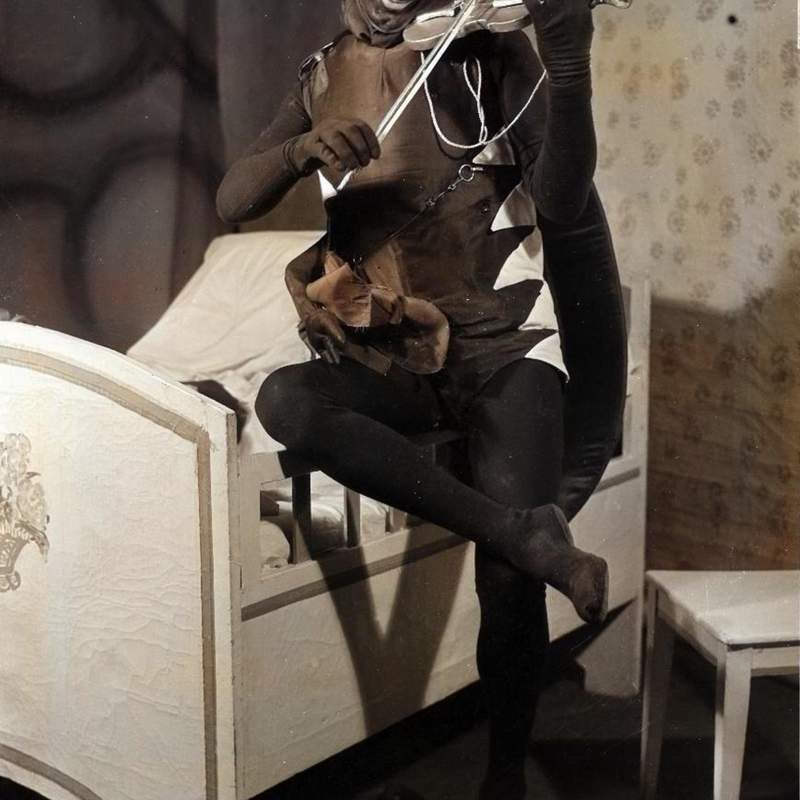
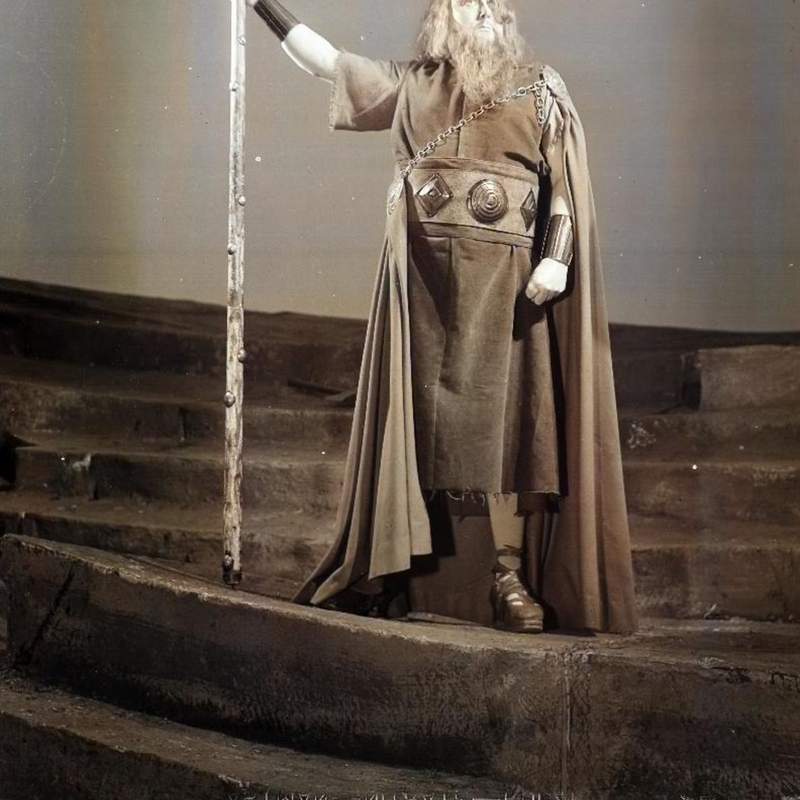
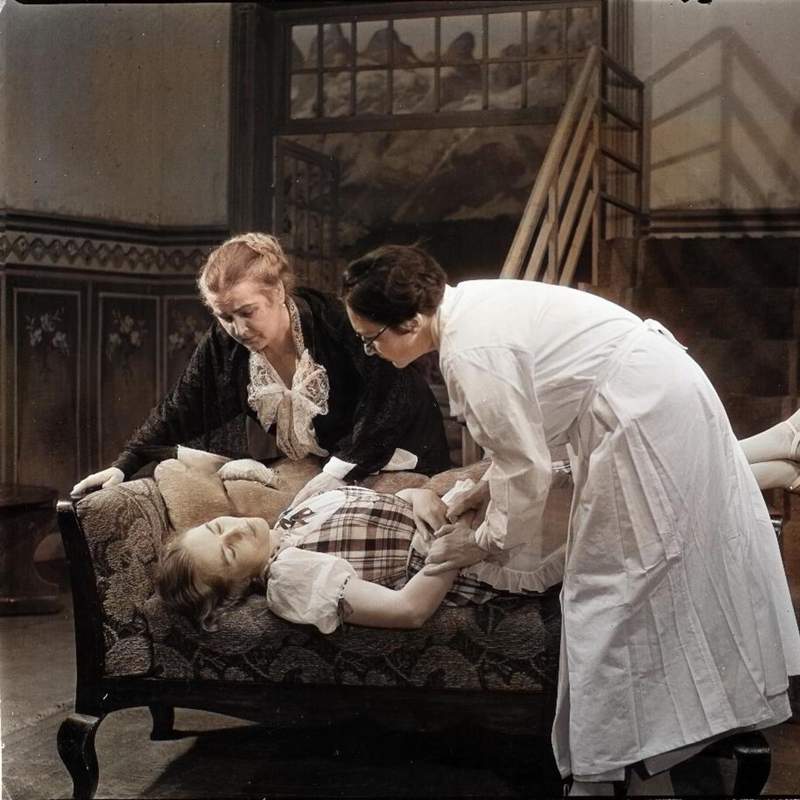
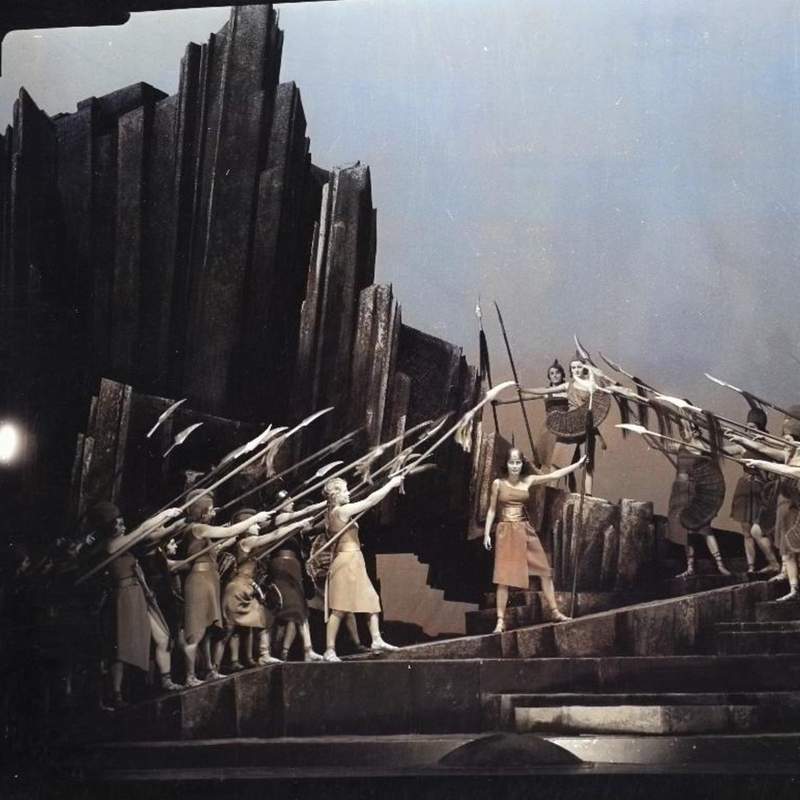
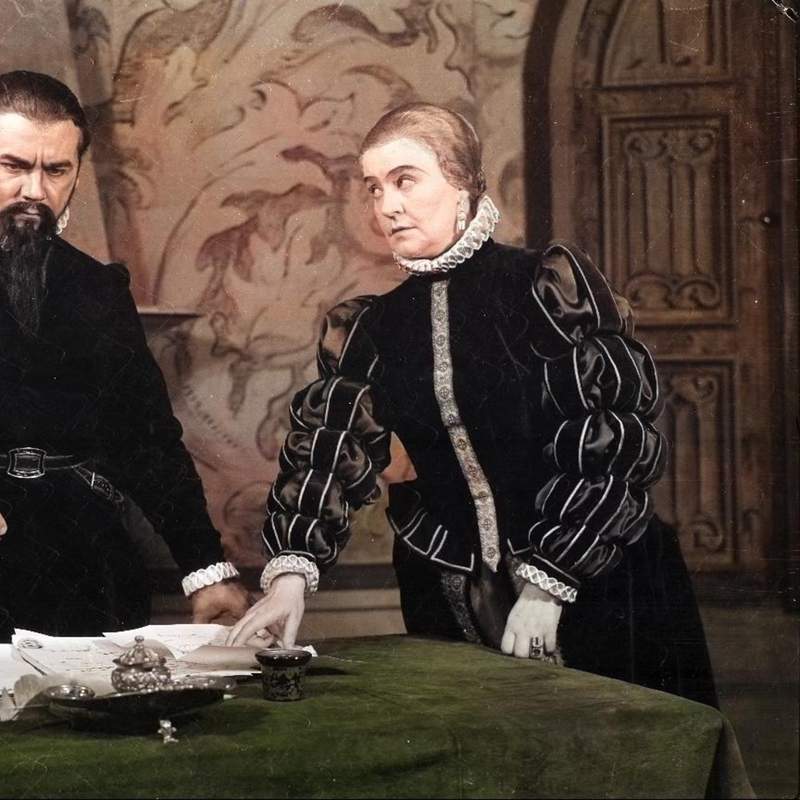
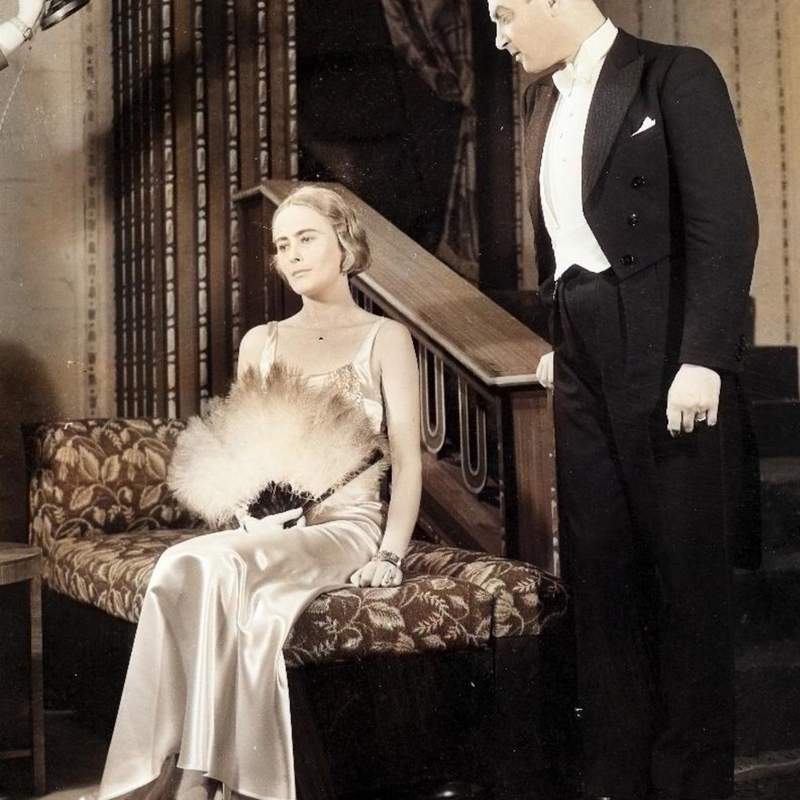
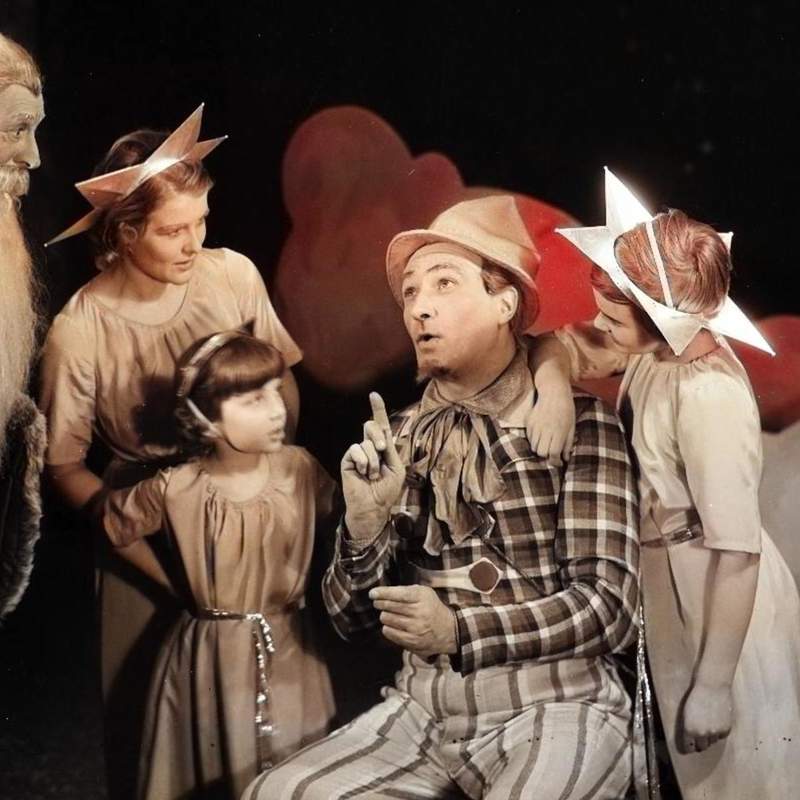
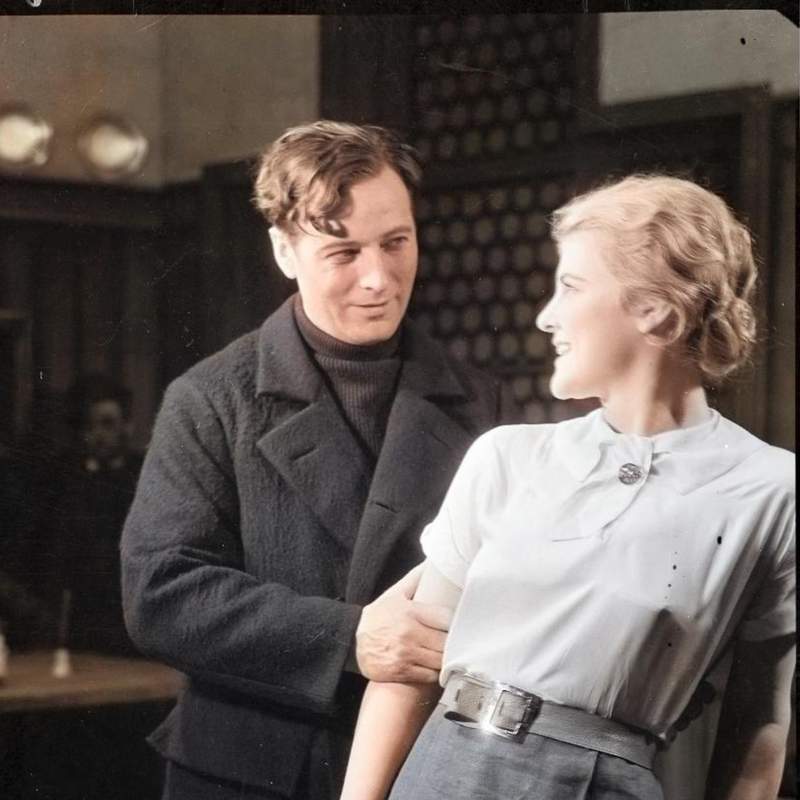
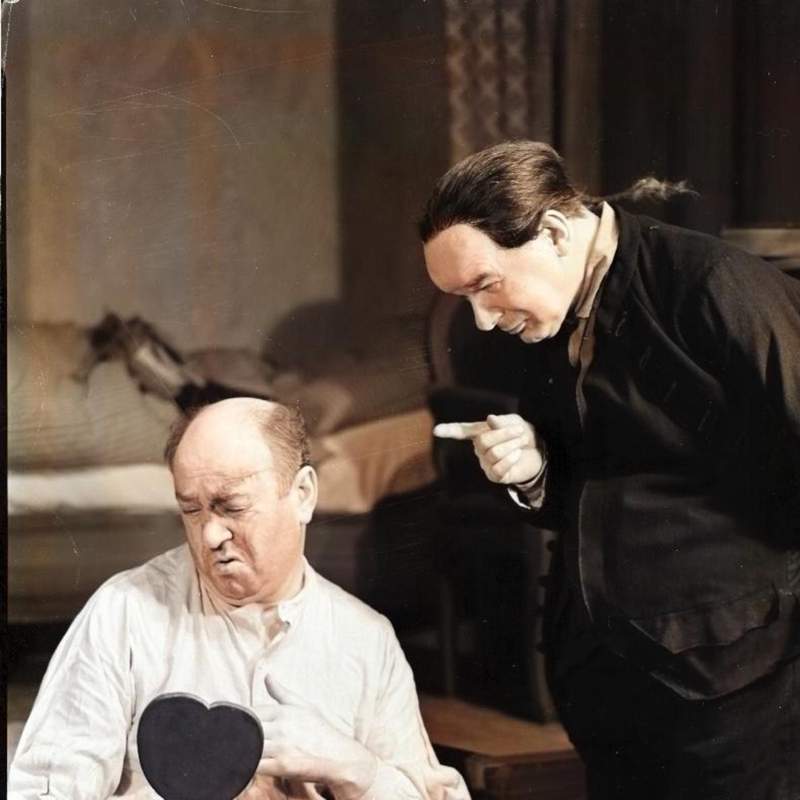
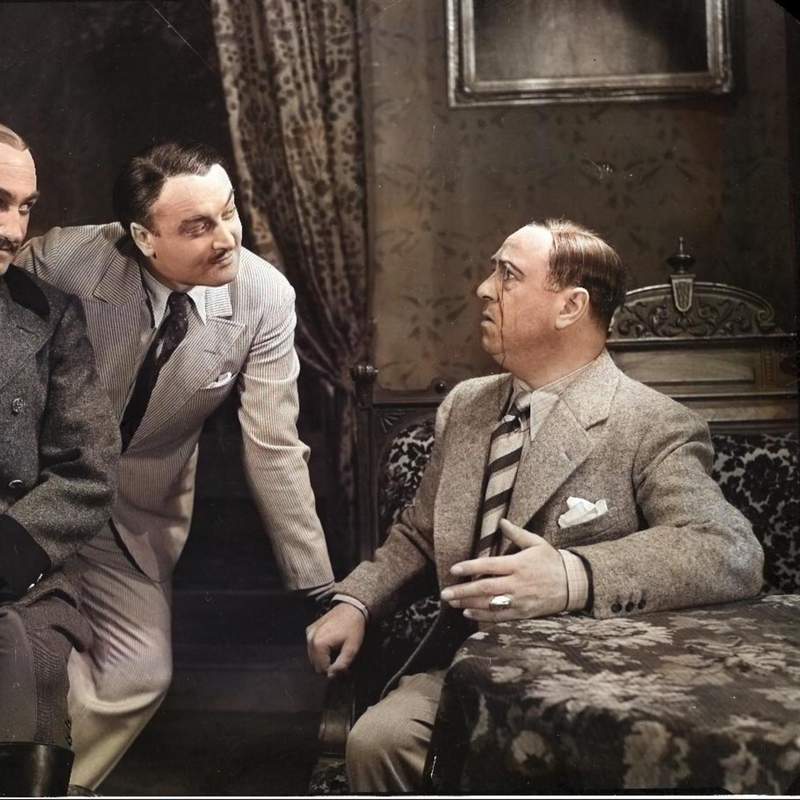
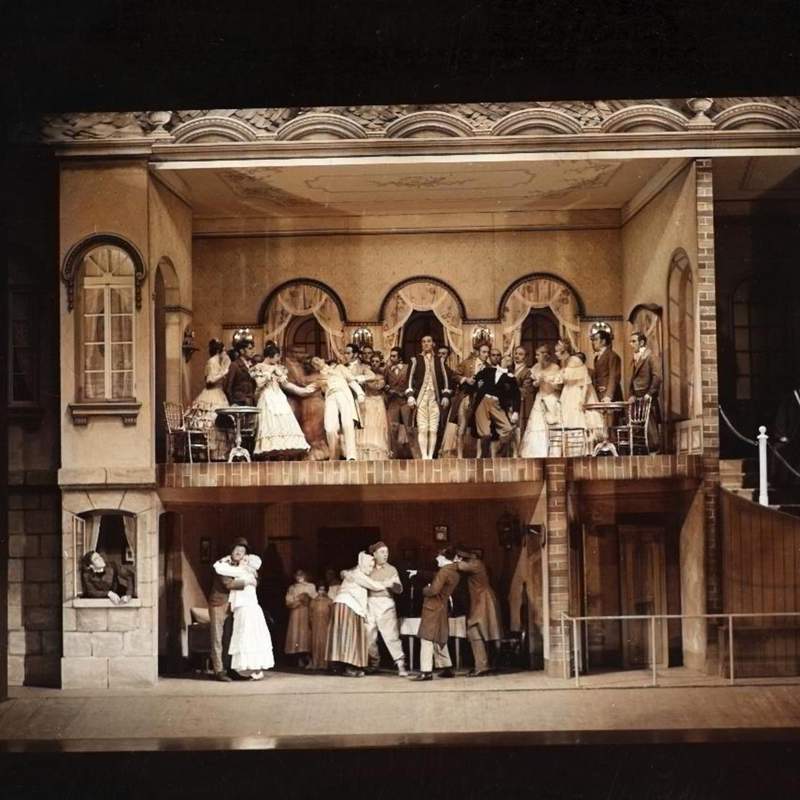
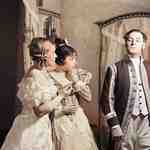
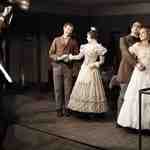
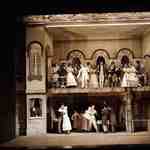
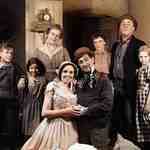
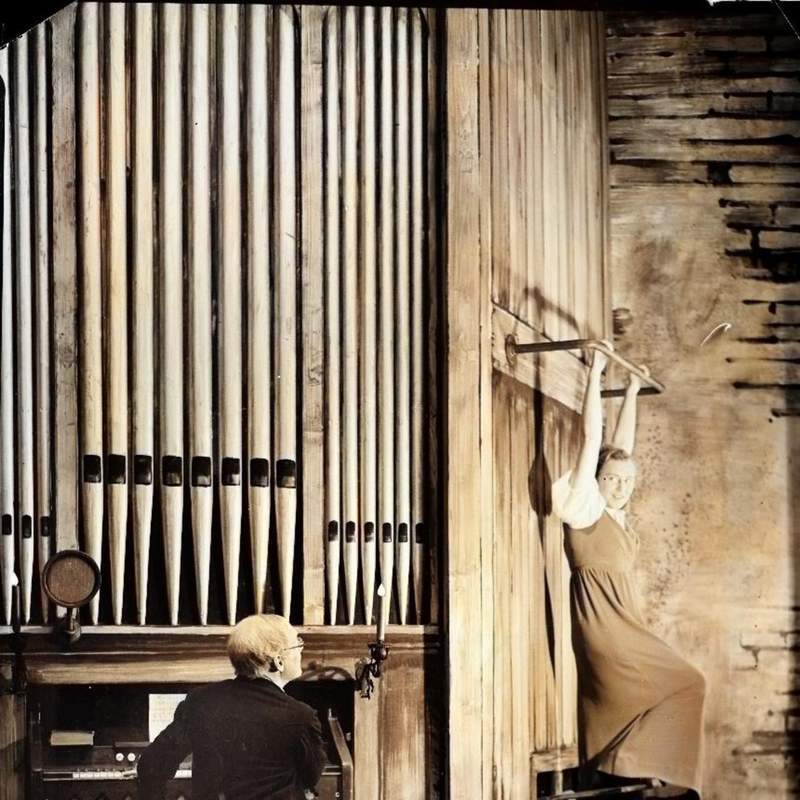
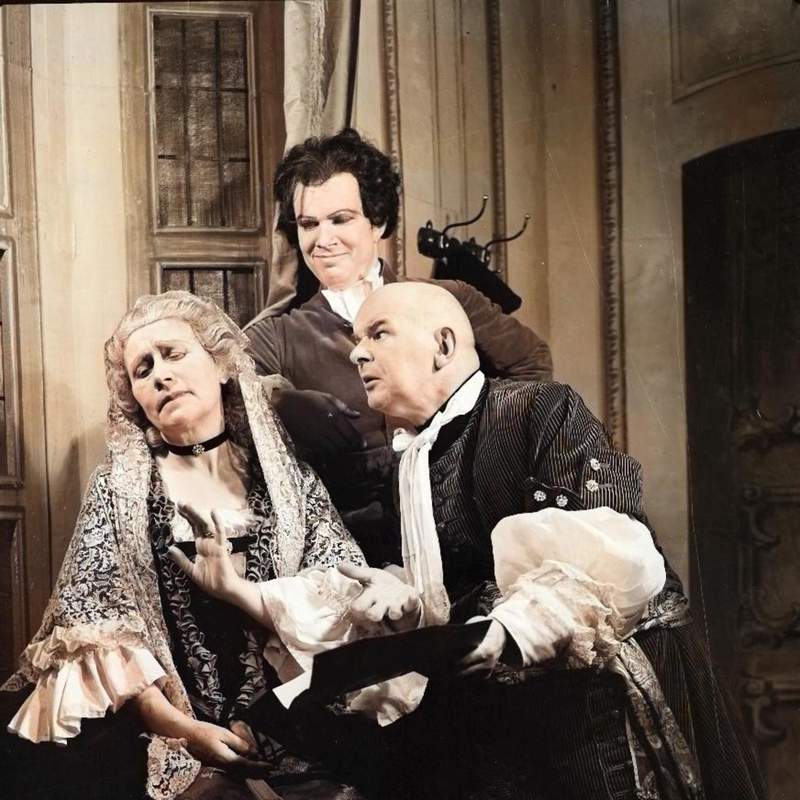
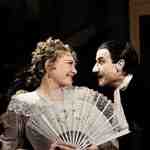
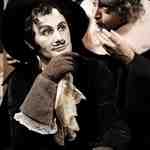
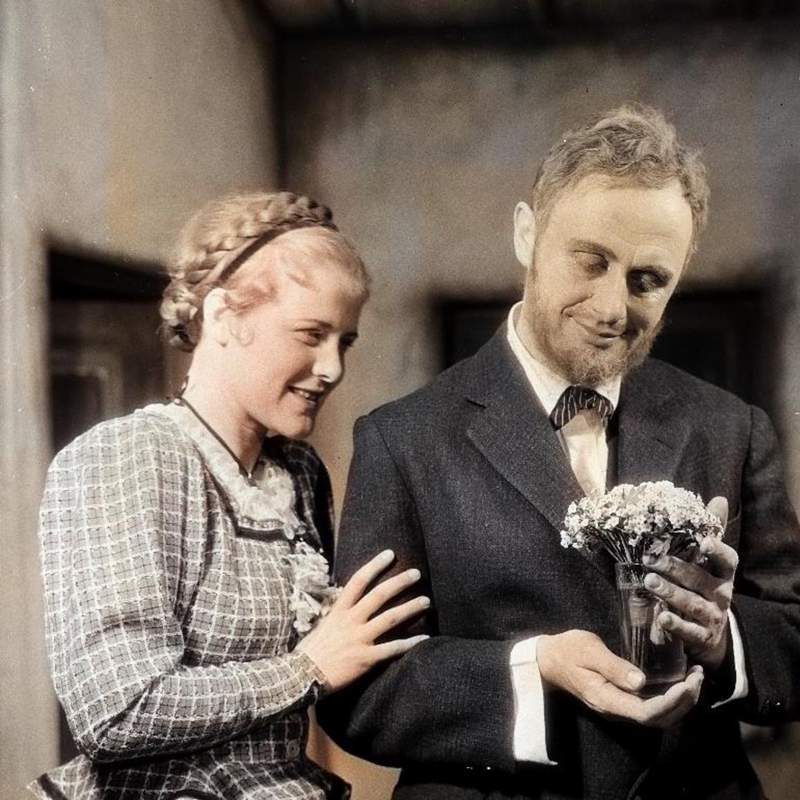
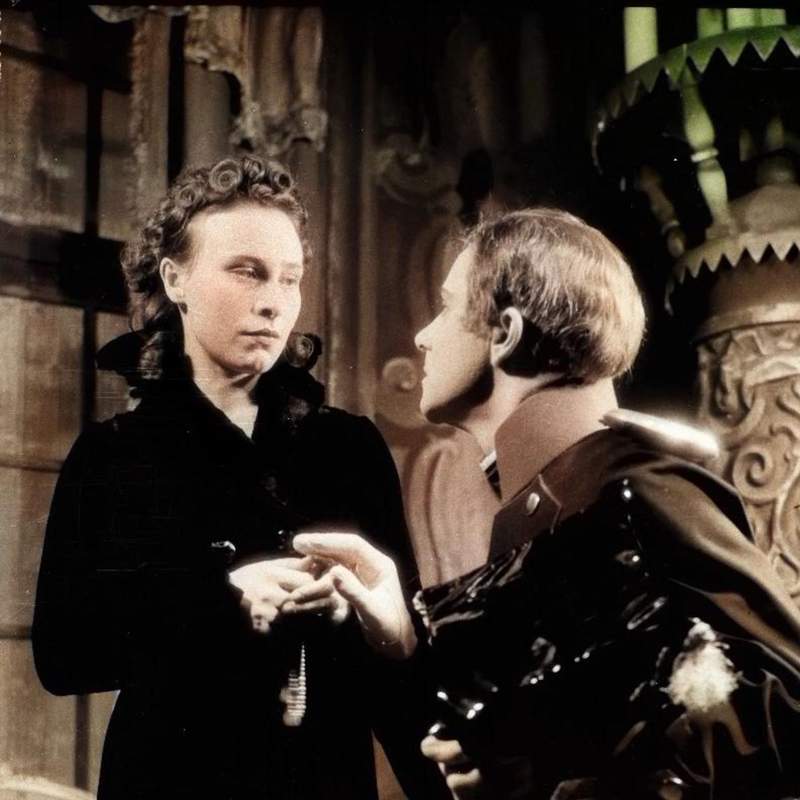
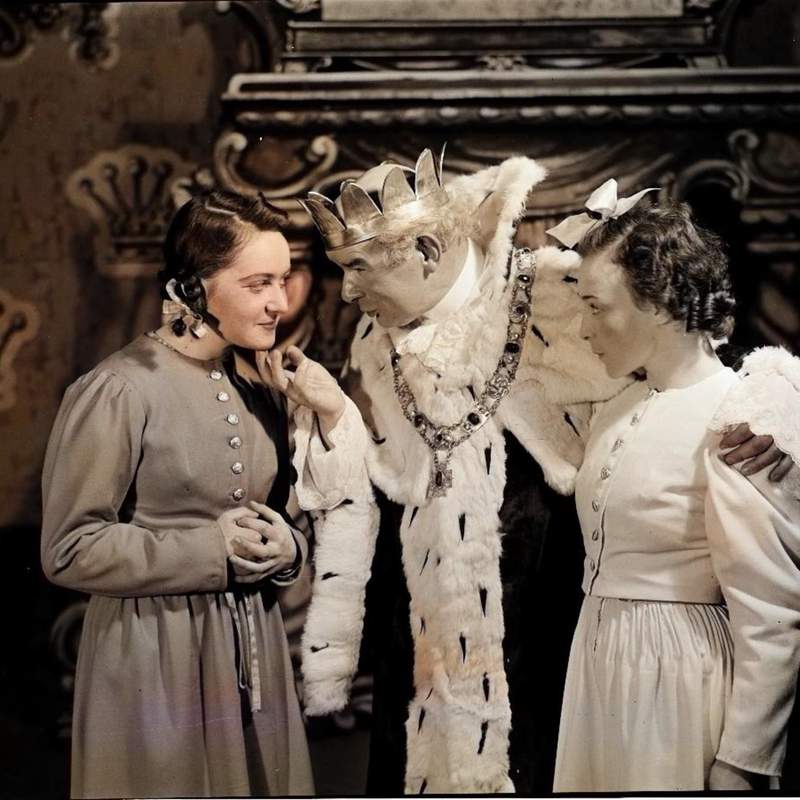
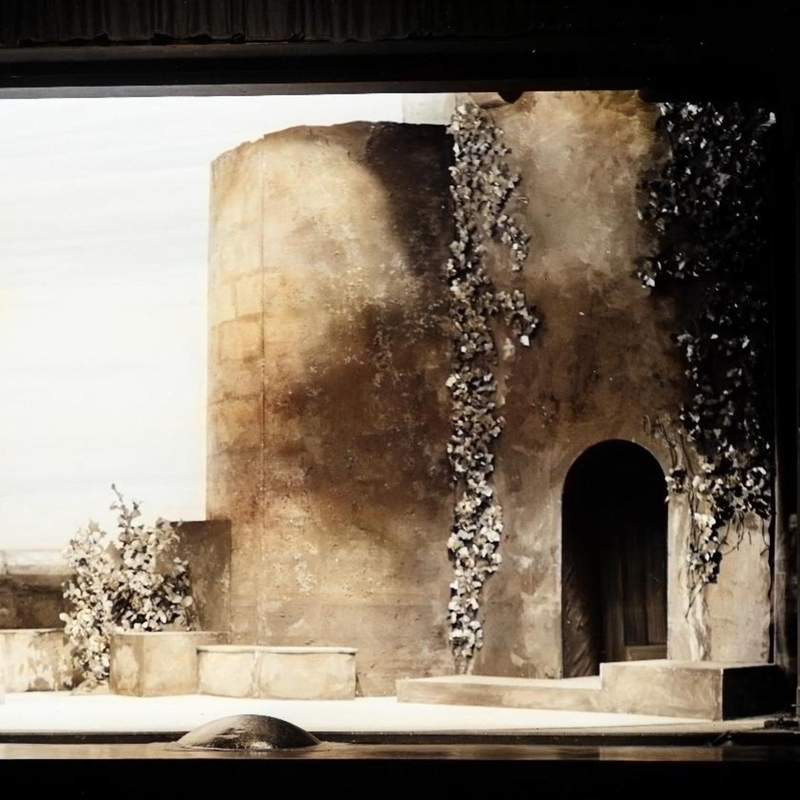
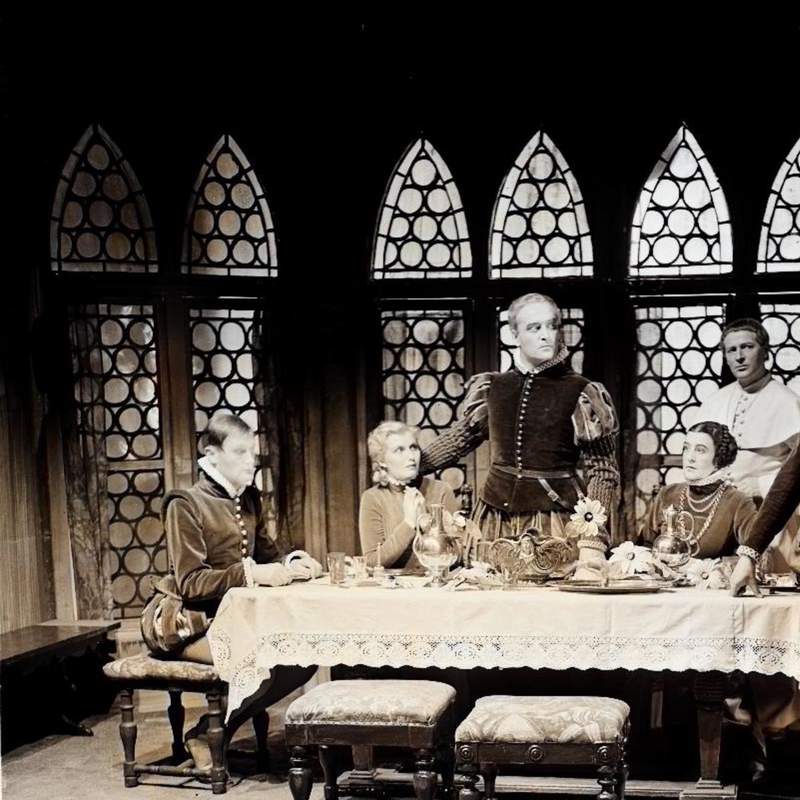
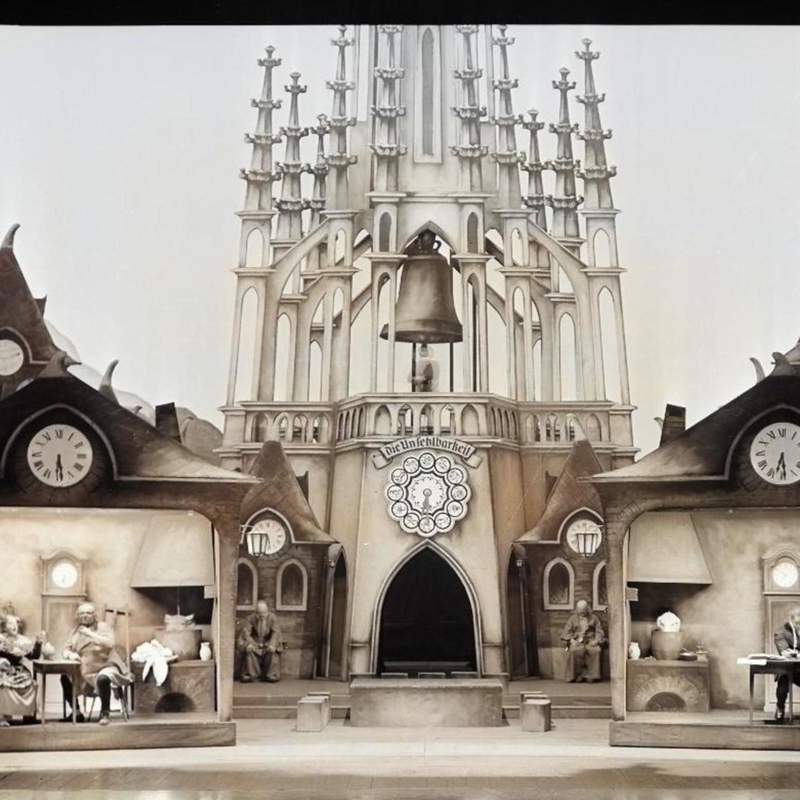
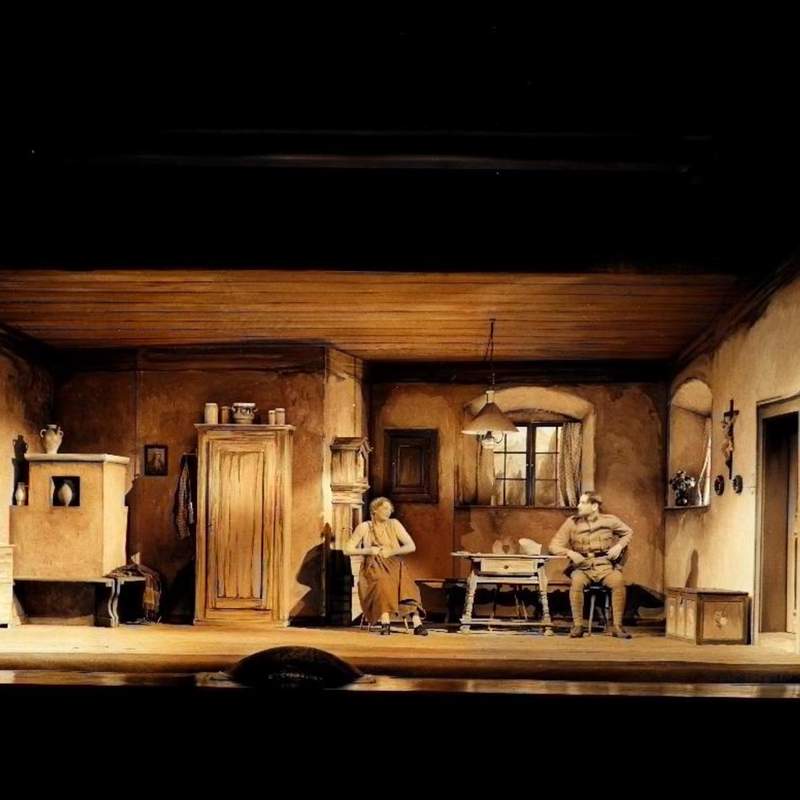
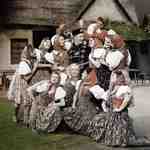
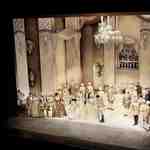
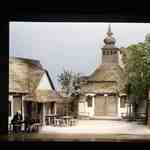
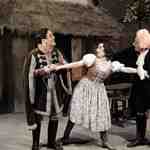
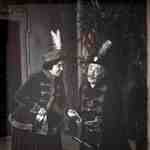
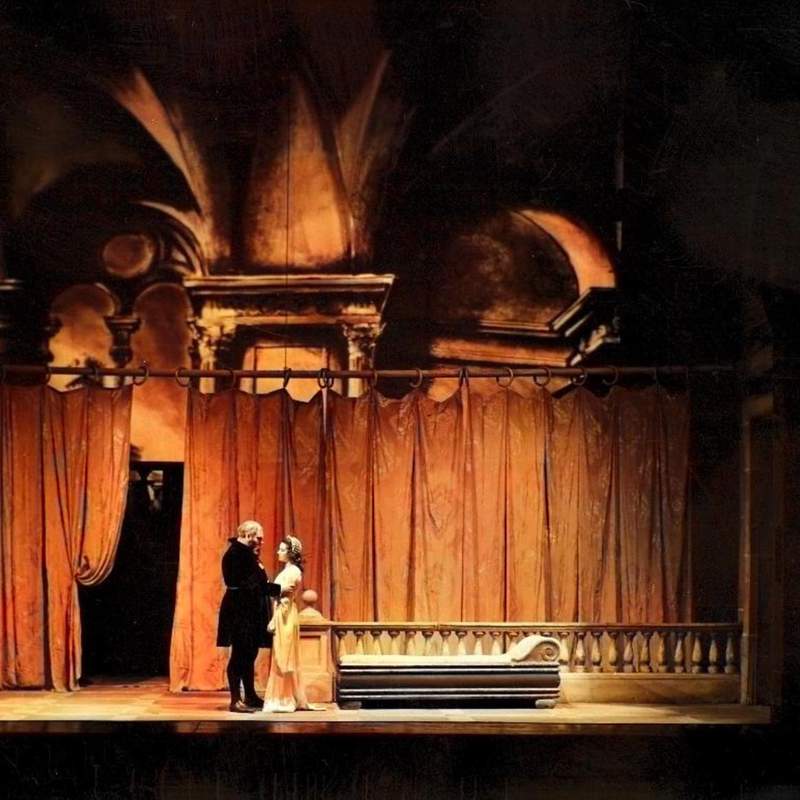
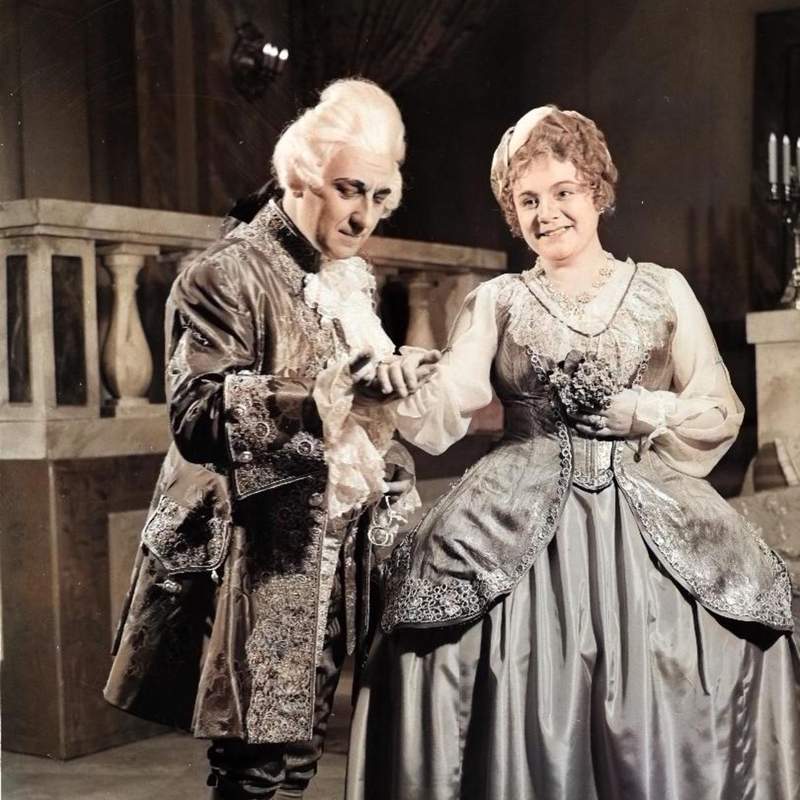
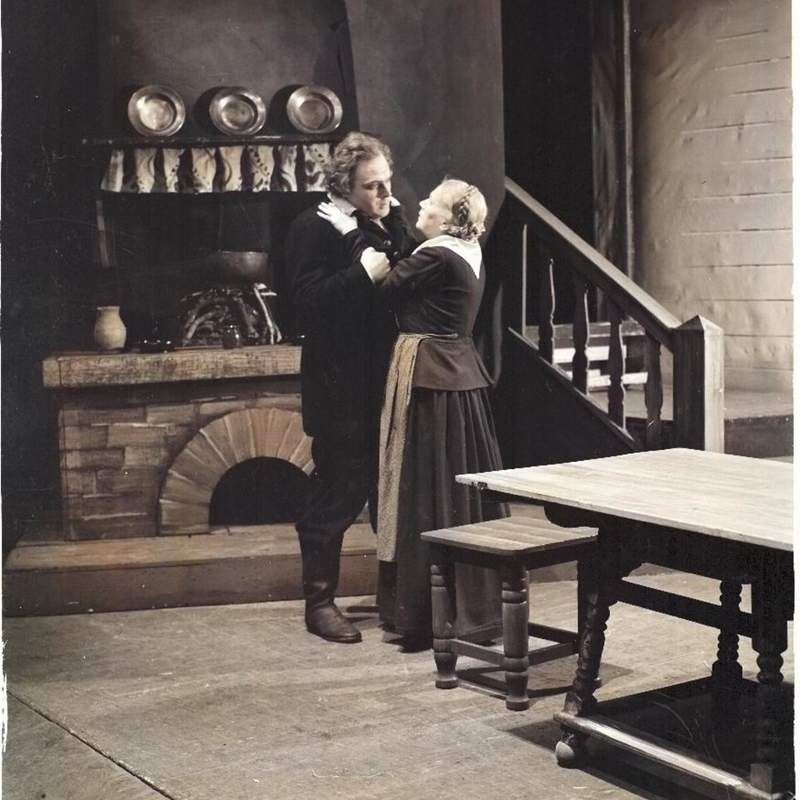
We colored the black and white photographs using a tool based on AI. In the viewer, these photographs are arranged in a timeline from 1912 to 1942 which can be explored by scrolling up and down. Swiping left and right reveals other performances which have taken place in the same year. By clicking on a title, you are directed to the Lodview interface which shows you all metadata we have for each of the performances.
25. Dezember 1918
More Images in the data set


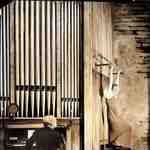
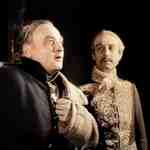
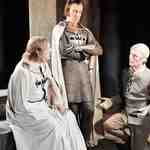
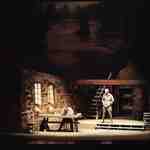
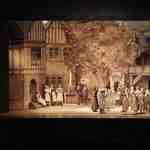
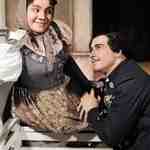
2. Oktober 1933
More Images in the data set


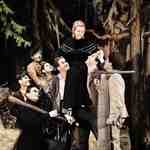
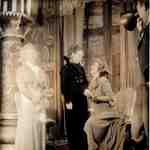
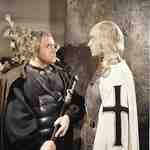
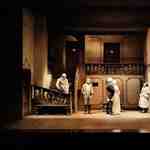
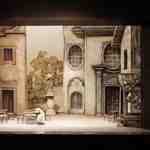
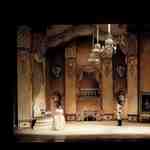
9. Dezember 1933
More Images in the data set


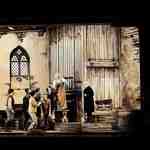
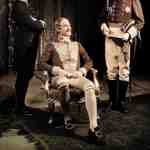
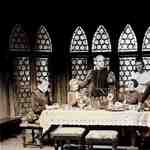
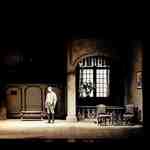
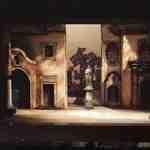
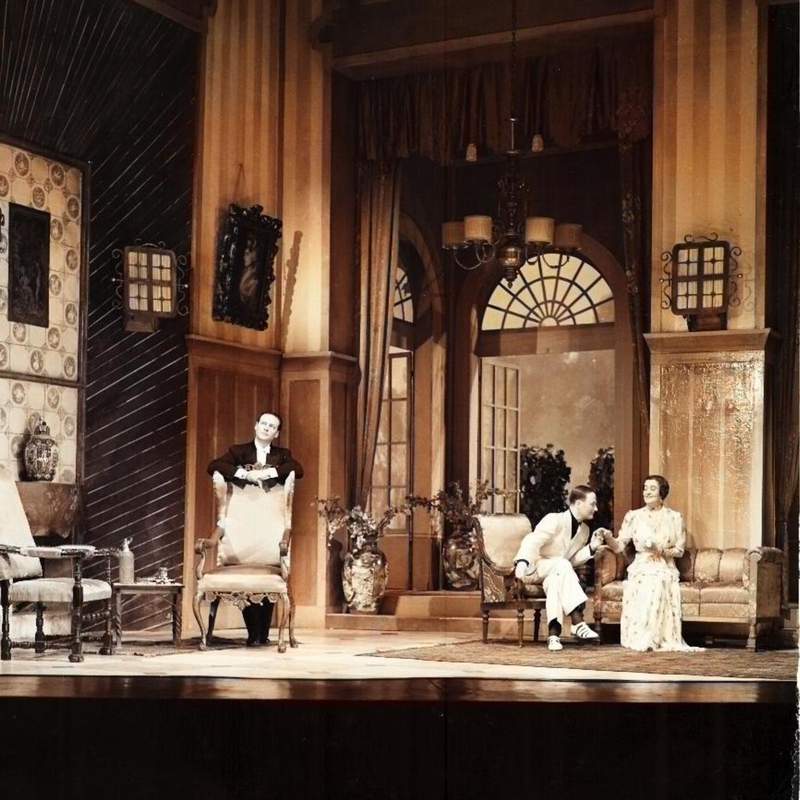
12. Mai 1934
More Images in the data set


12. Dezember 1935
More Images in the data set


12. Juni 1936
More Images in the data set


18. September 1936
More Images in the data set


20. Februar 1937
More Images in the data set


5. Dezember 1937
More Images in the data set


8. September 1938
More Images in the data set


4. Februar 1939
More Images in the data set


12. November 1939
More Images in the data set


8. Februar 1940
More Images in the data set


6. April 1940
More Images in the data set


12. November 1940
More Images in the data set


12. Juni 1941
More Images in the data set